What is the right geographical allocation for a European investor?
Europe, USA or global? How to build a balanced portfolio based on geography
7 August 2025 · 18 min read

Why the right geographical allocation is different for a European investor
Geographic allocation is the way you split your investments across different regions of the world: the US, Europe, emerging markets. When you design a portfolio, one of the most critical (and at the same time most misunderstood) questions is:
“How much geographic exposure should I have? And to which regions of the world?”
For an investor based in Europe, this question is more complex than it looks.
🔶 What does the “right” geographic allocation mean?
The right geographic allocation is not one specific ratio that “works for everyone”.
It is the balance that emerges when your investments align with your strategy, your psychology and your personal goals. Every investor has different needs, so the ideal allocation changes from person to person.
Your allocation is influenced by:
- Your investment strategy
If you apply DCA, you can tolerate more volatility. If you invest with a lump sum, you may prefer more stable geographic exposure.
- Your risk tolerance
If you can tolerate sharp swings, you can add more emerging markets or thematic exposures.
If you prefer calm and predictability, developed markets will form the core.
- Your confidence in individual markets
Some investors trust the US more, others want a stronger European presence and others believe in emerging economies.
- Currency influences (EUR vs USD exposure)
Your dollar exposure can boost or reduce your returns, depending on currency fluctuations.
The right mix protects you from excessive dependence.
- Your time horizon
The more years you have ahead of you, the more room you have for markets with higher growth but also greater volatility.
🔶 Why a European should think differently from an American
Most passive investors follow the “pure” market-cap-based allocation: what we call market-cap weighted global exposure.
In practice this means:
- 60–70% US
- 20–25% Europe + Japan
- ~10–12% Emerging markets
This model works very well for an American investor, who already lives and spends in dollars, invests in companies of their own country and has a “natural hedge” in USD.
For a European investor, however:
- The reference currency is the euro (or another European currency)
- USD exposure also carries currency risk
- Domestic markets (e.g. the Eurozone or the UK) have a different cycle from the US
- Taxation may be affected by the geography of the assets
- Many ETFs are UCITS, domiciled in Ireland or Luxembourg and differ in terms of protection & efficiency
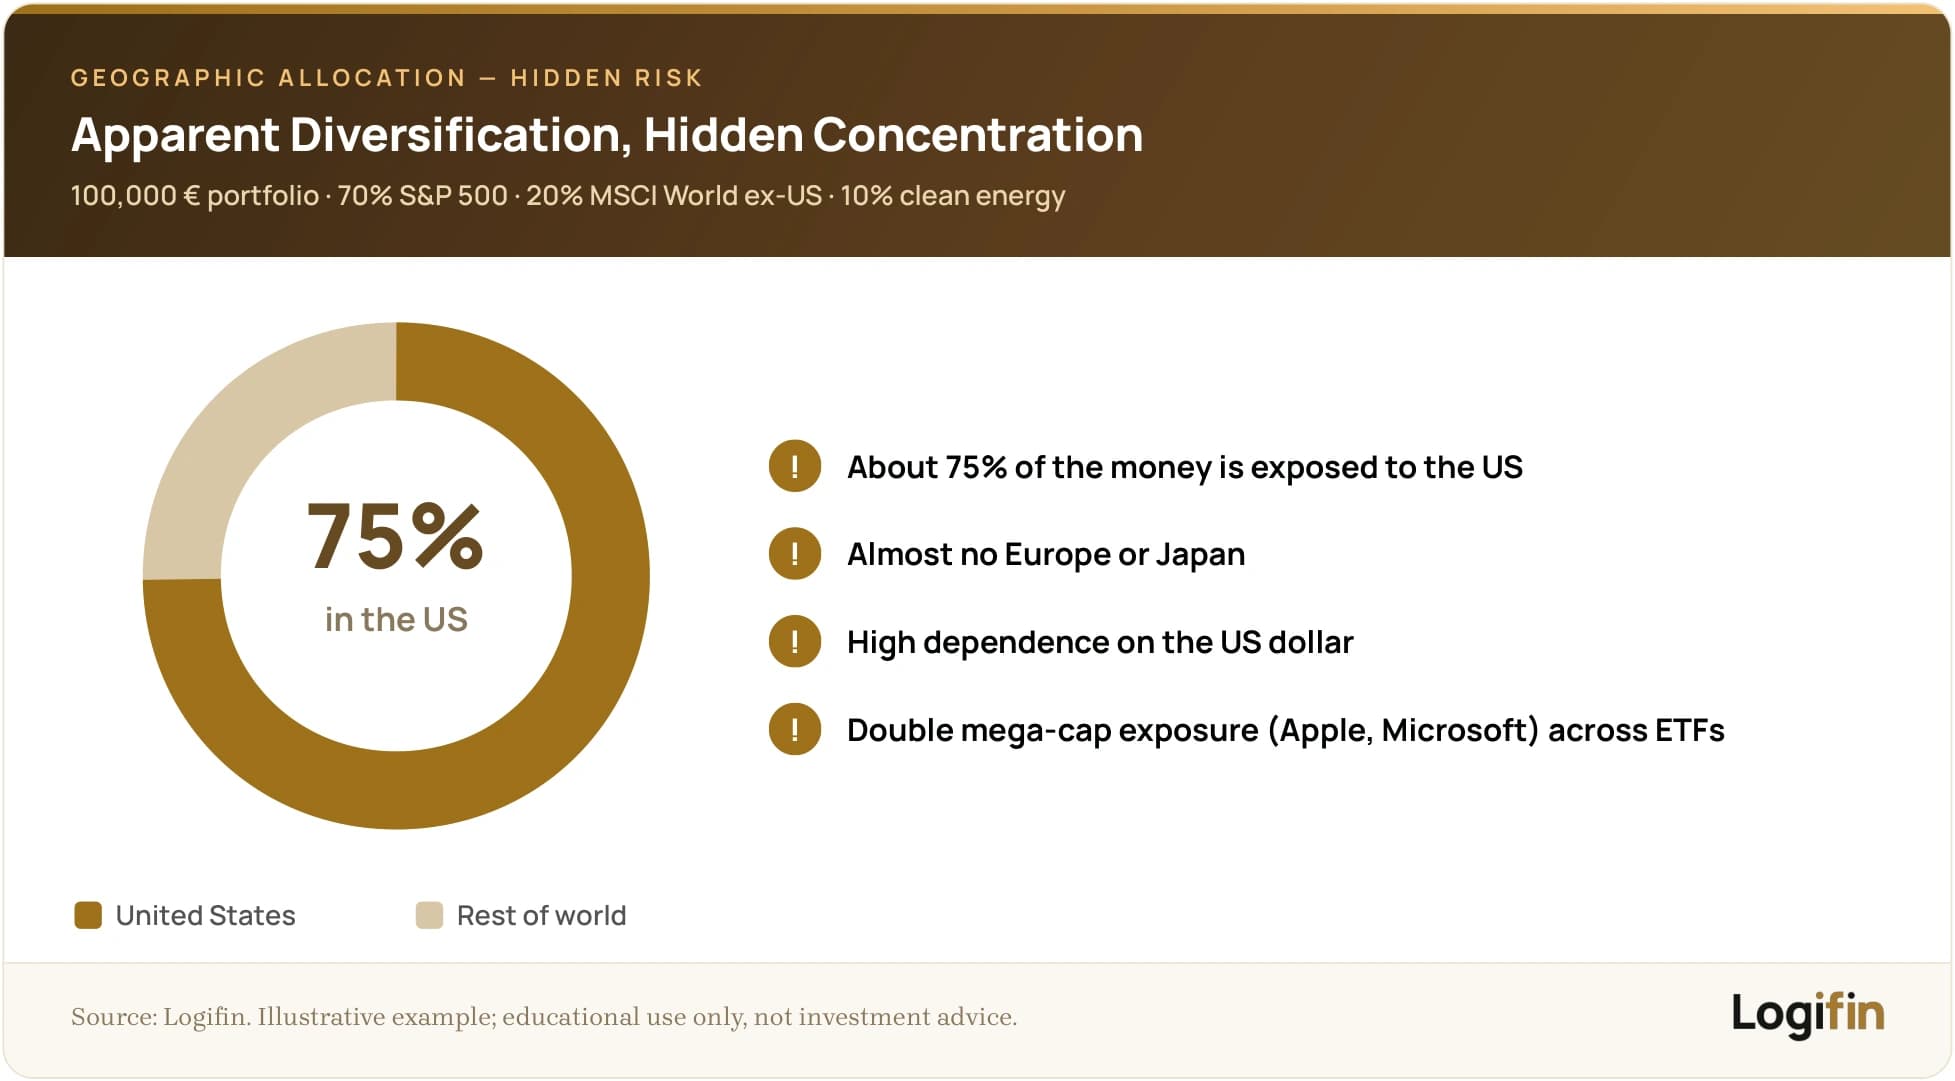
Example: Suppose you have invested 100,000 € in ETFs with 70% S&P 500, 20% MSCI World ex-US and 10% thematic clean energy.
On paper, you have diversification. But in practice:
- You have roughly 75% exposure to the US
- You have almost no Europe or Japan
- You have a high dependence on the dollar
- And probably double exposure to mega-caps such as Apple or Microsoft through multiple ETFs
This can be fine if you have strong confidence in the American economy.
But it may not be the right choice for every European investor, especially if you want to protect your capital from currency swings or you want a more balanced portfolio with exposure to your local market too.
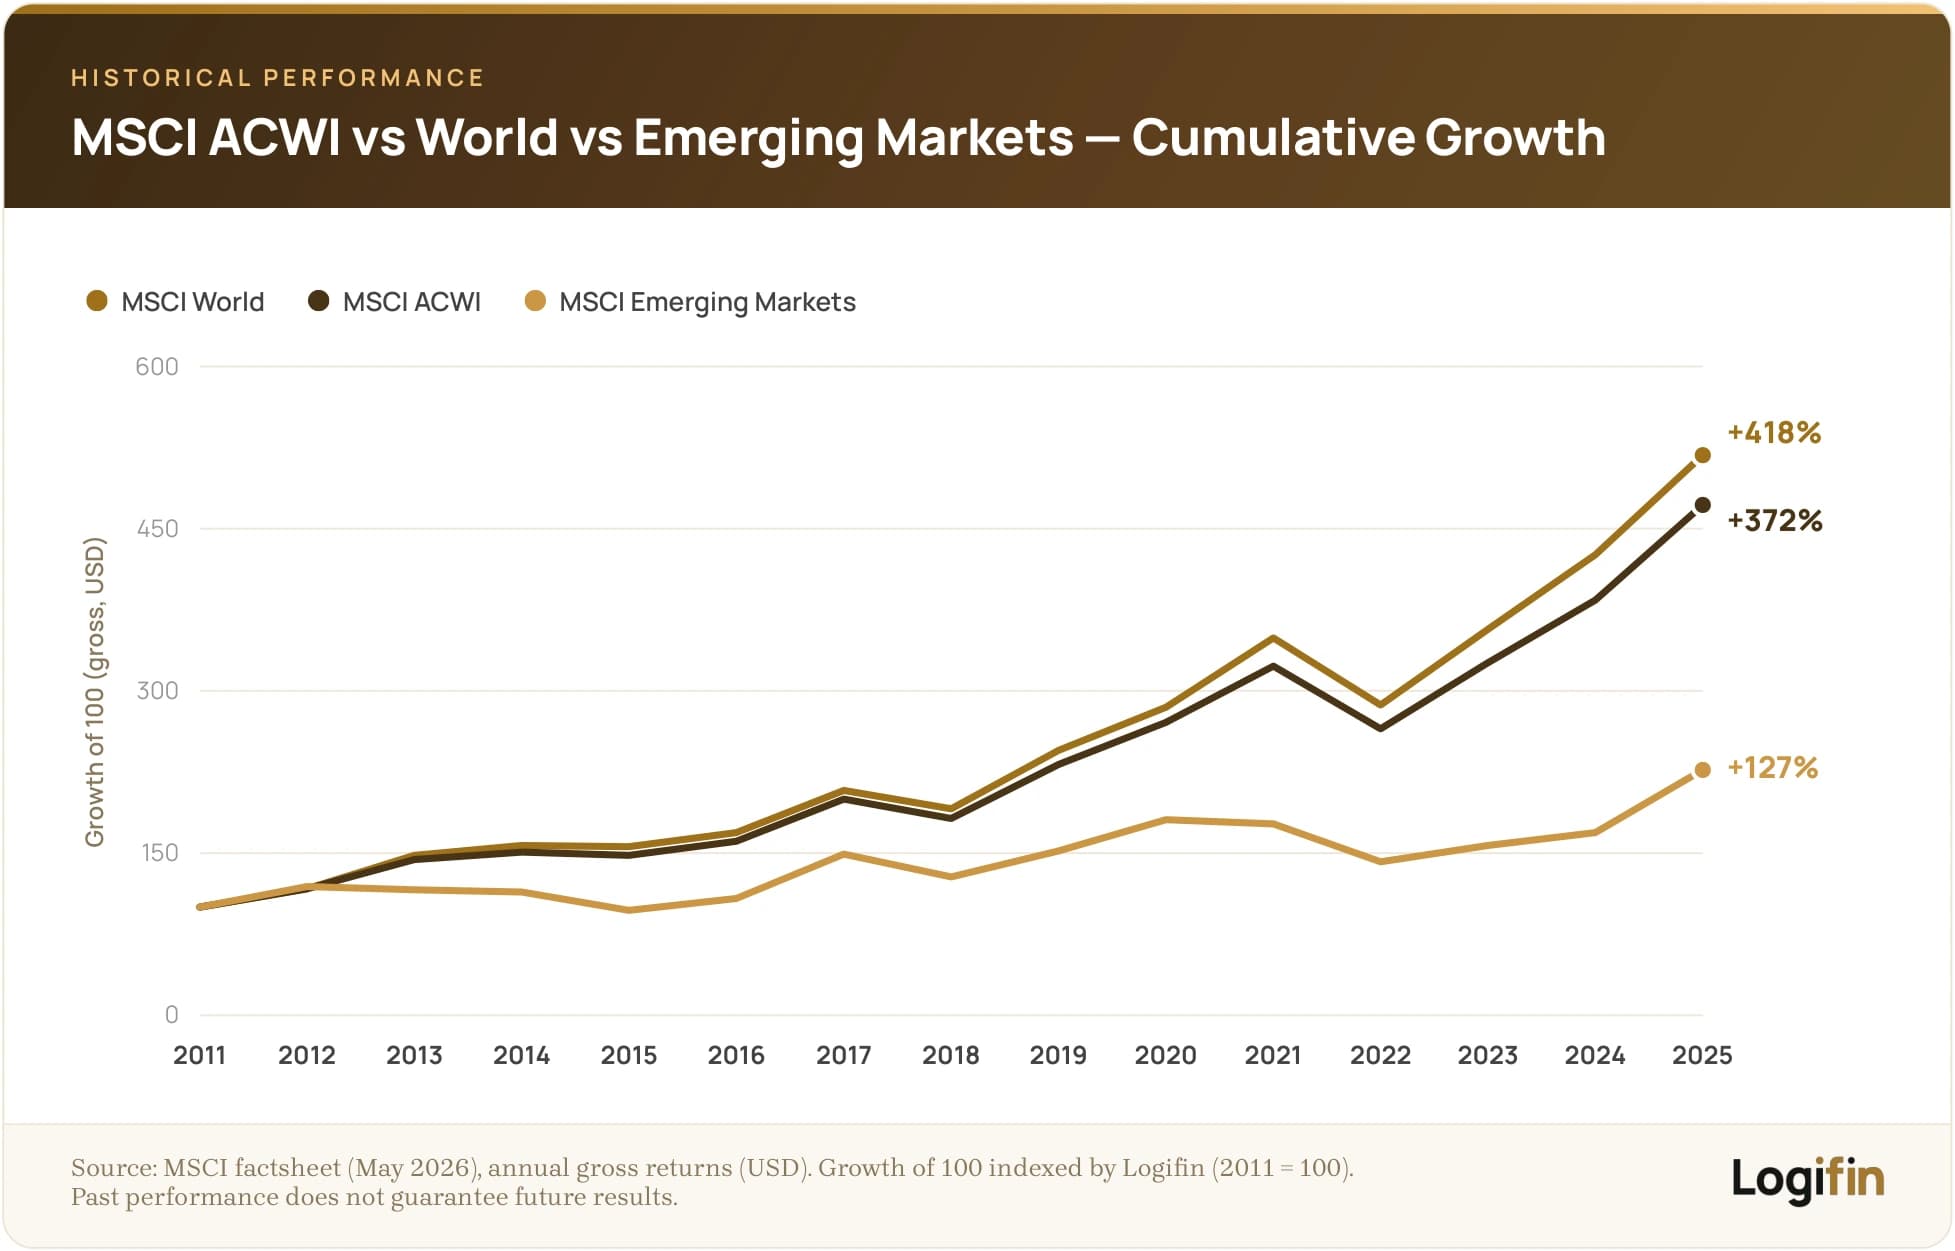
What history shows — US vs Europe vs global market performance
Over the past 15 years, most investors will tell you the following:
“America outperformed everything. Why look elsewhere?”
This is partly true, but only if you examine the data over specific time periods, without context.
If we look at the historical data over the long run, we find that:
- The US does not always outperform
- Europe had significant periods of strong performance
- The global indices (such as the ACWI) offer balance, but not necessarily the best return
- And everything depends on the investor’s currency base (e.g. EUR vs USD)
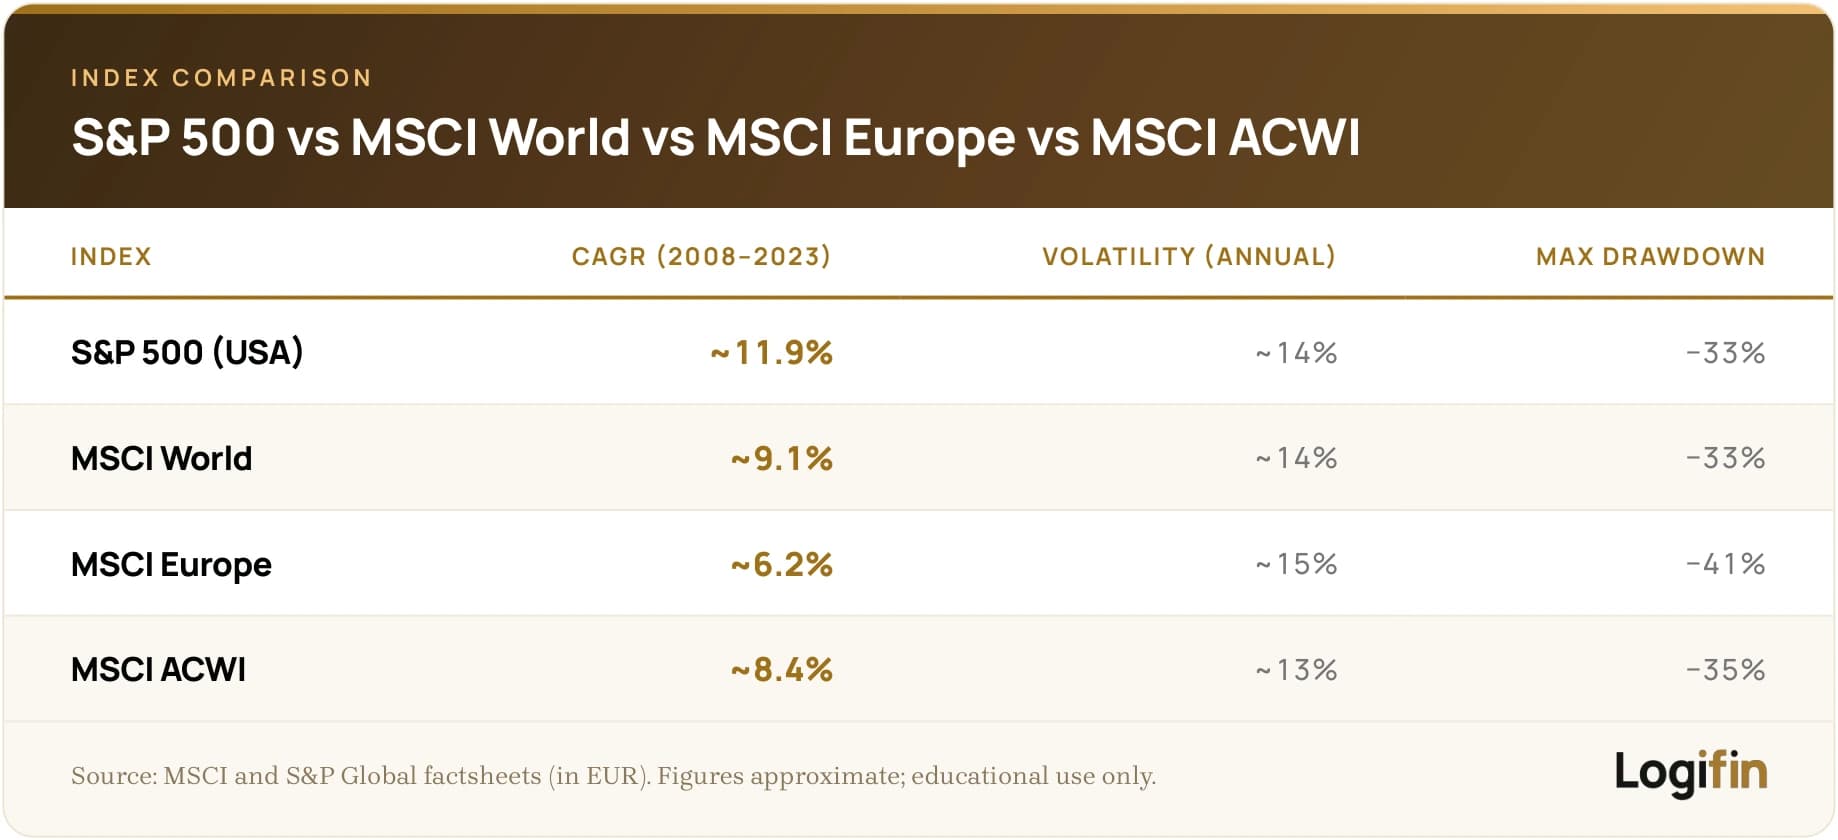
🔶 15-year performance (2008–2023) in EUR, Annualised
Before we compare the indices, it is useful to see how they perform over the long run so we can understand the differences in growth, volatility and maximum drawdown.
🔶 US: Outperformance but also high concentration
The American market has stood out over the past decade for 3 reasons:
- Technological dominance: Apple, Microsoft, Nvidia, Meta, Amazon, etc.
- Efficient markets & corporate profitability
- Attractive monetary policy: mainly for foreign investors
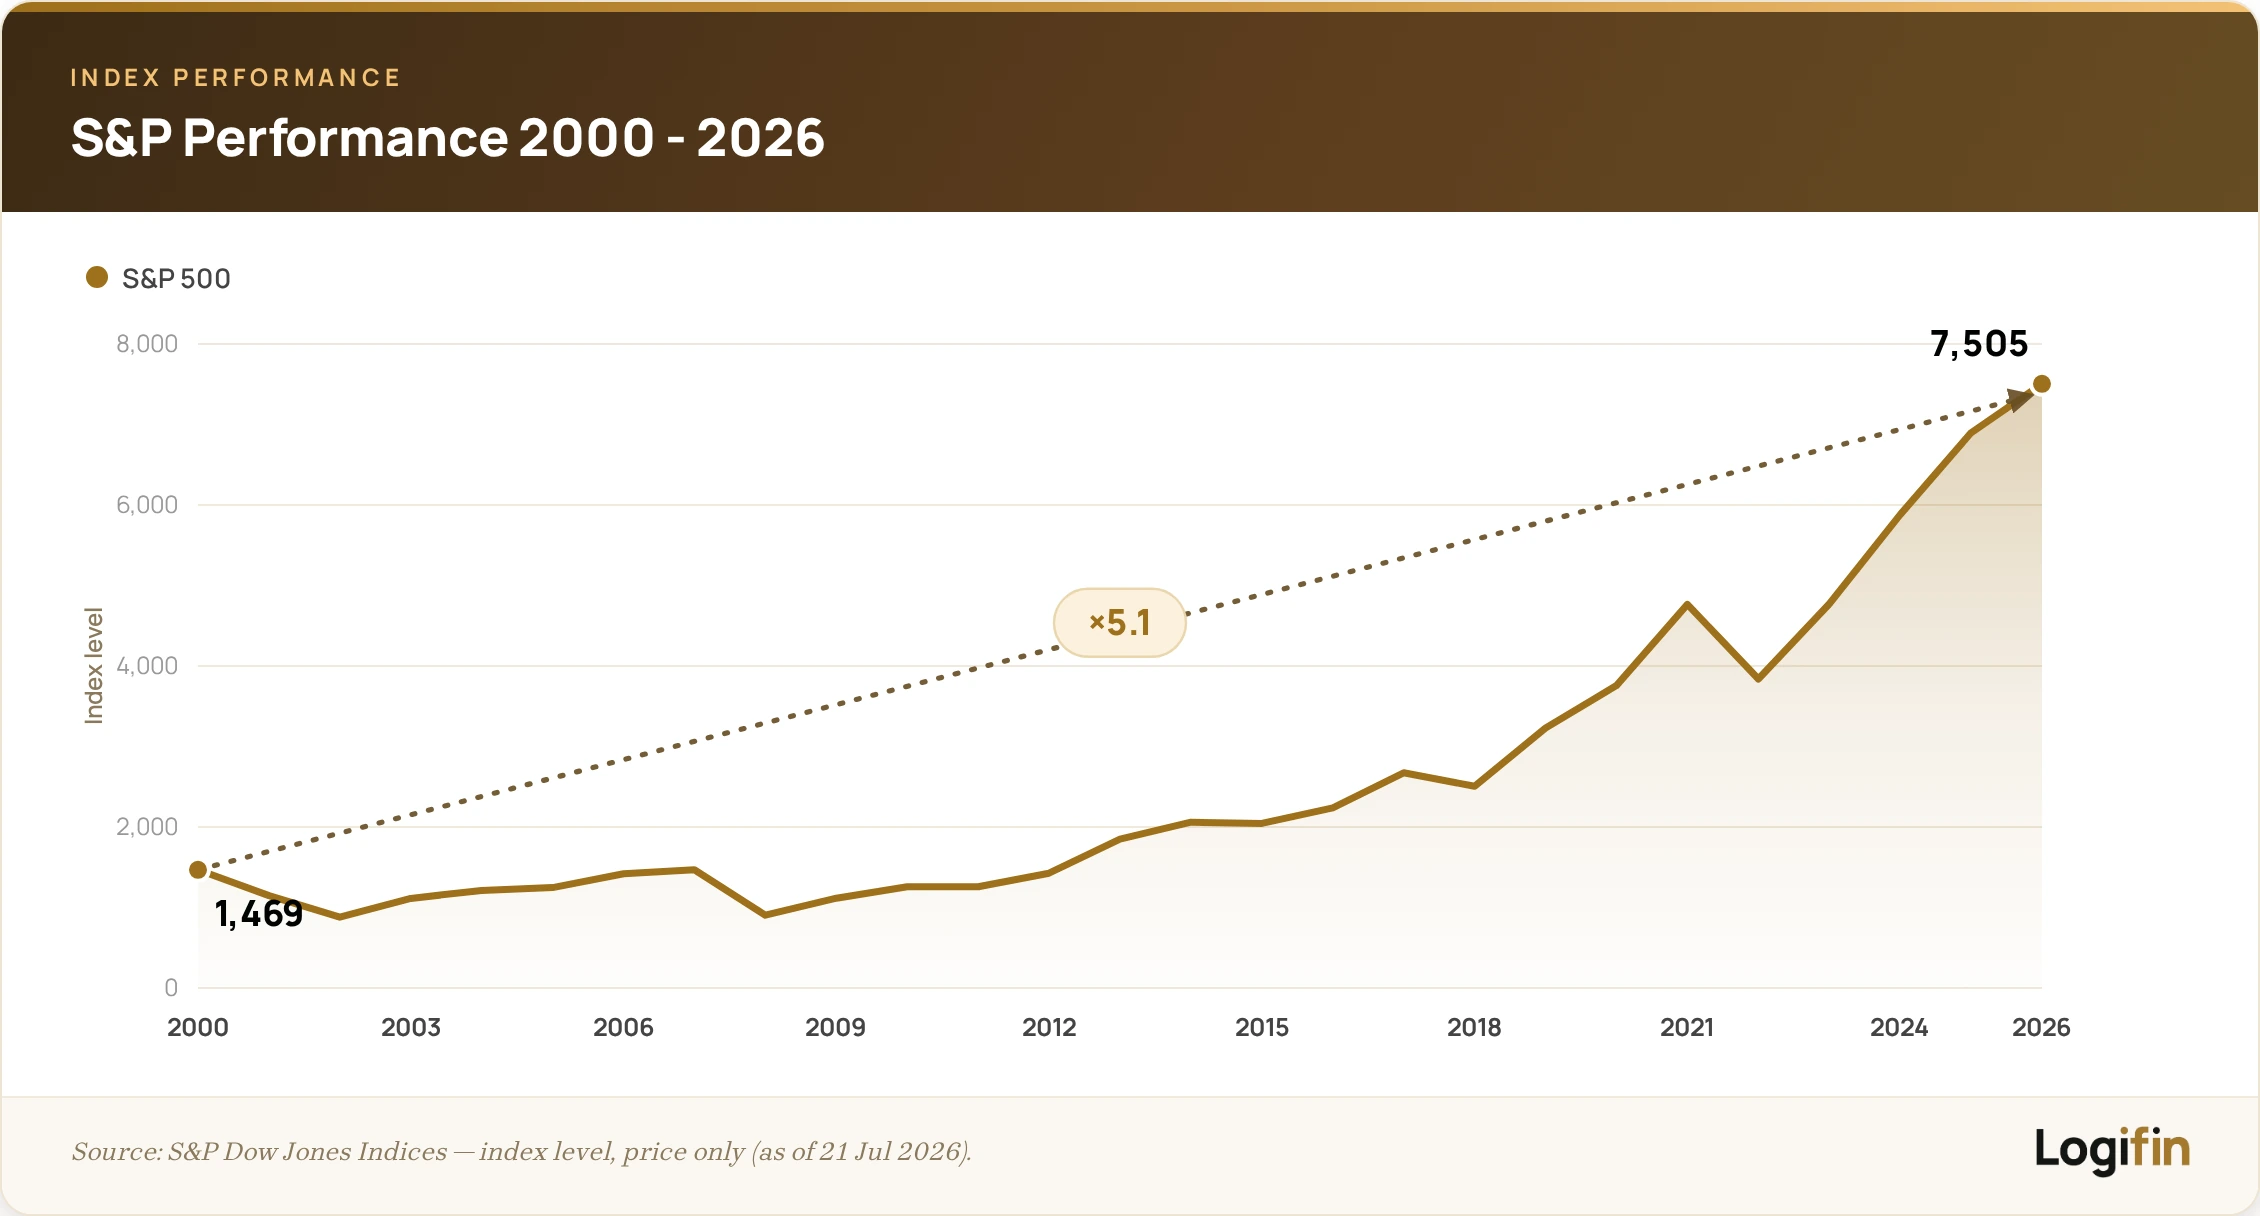
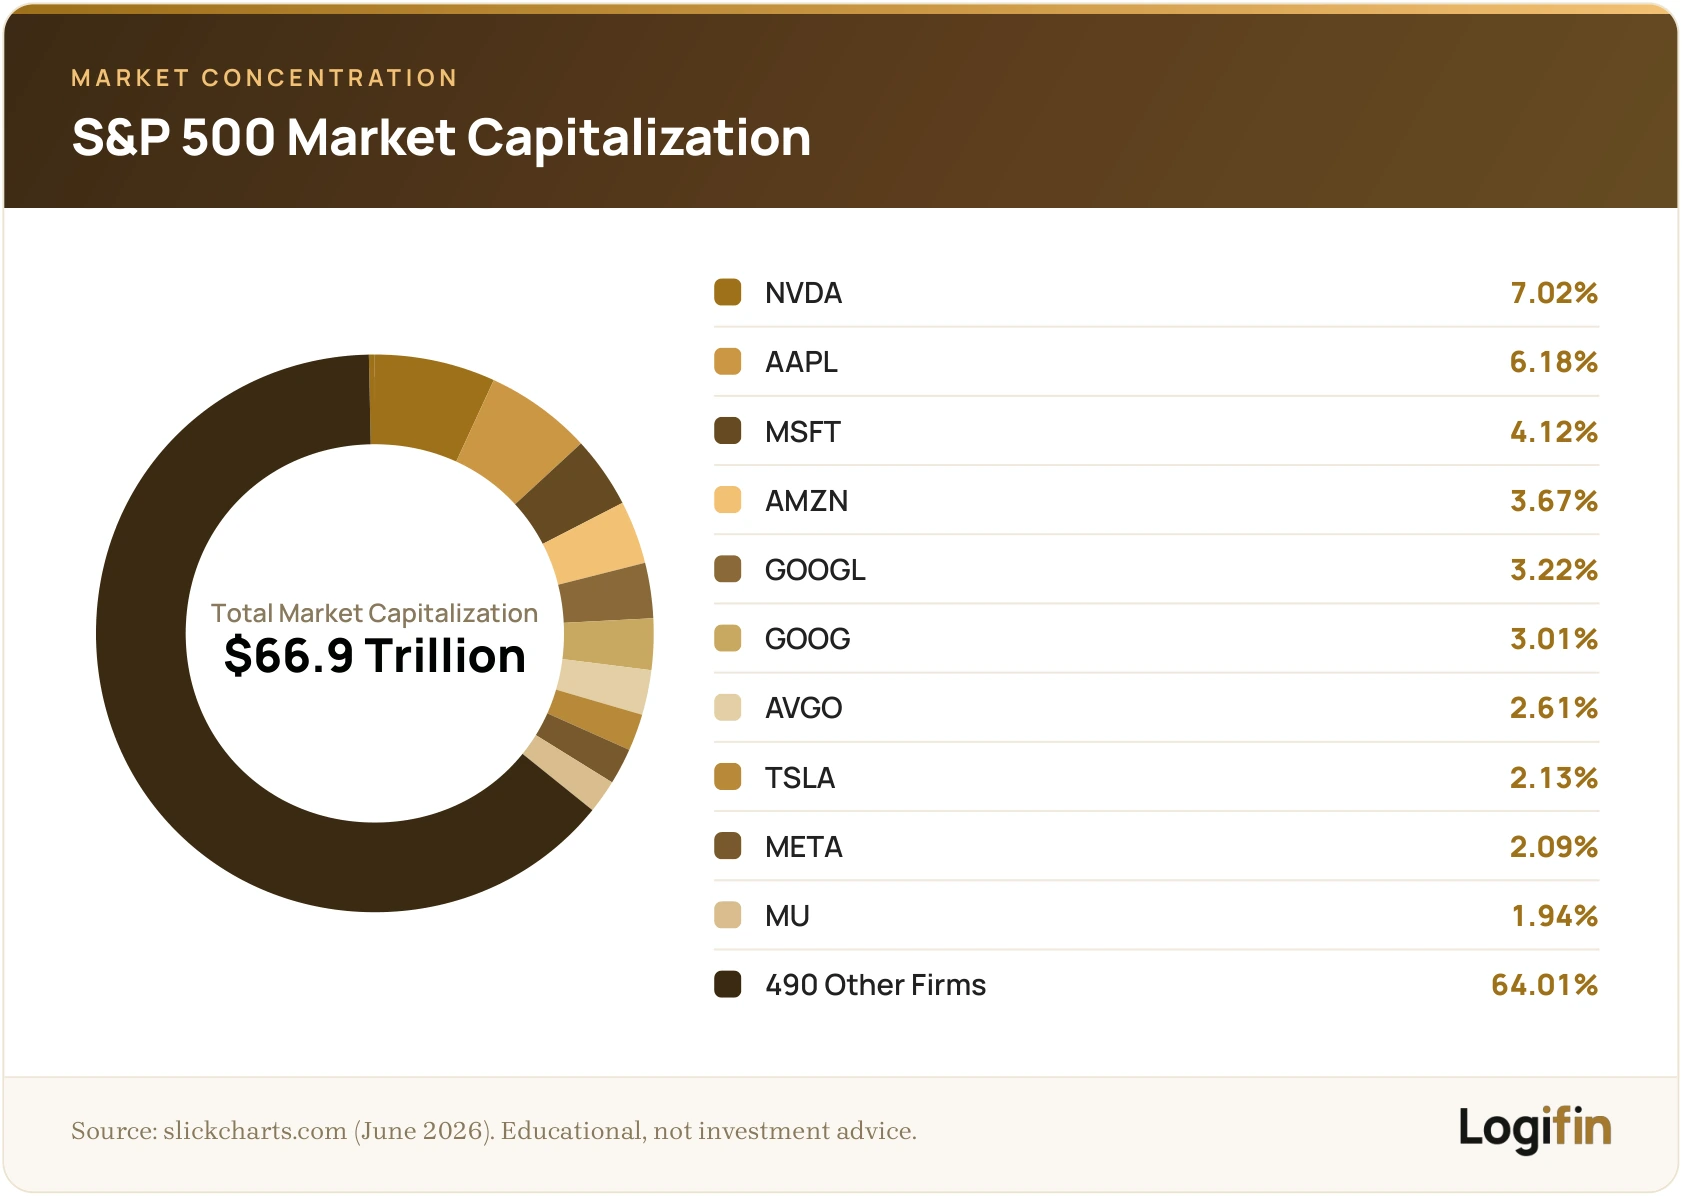
However, the strong performance also comes with increased concentration in a few mega-caps. The S&P 500 in 2026 has ~35% of its weight in 7 companies.
This creates excellent returns in bull markets, but also increases the risk of a future correction.
🔶 Europe: Lagging on performance, an edge on valuations
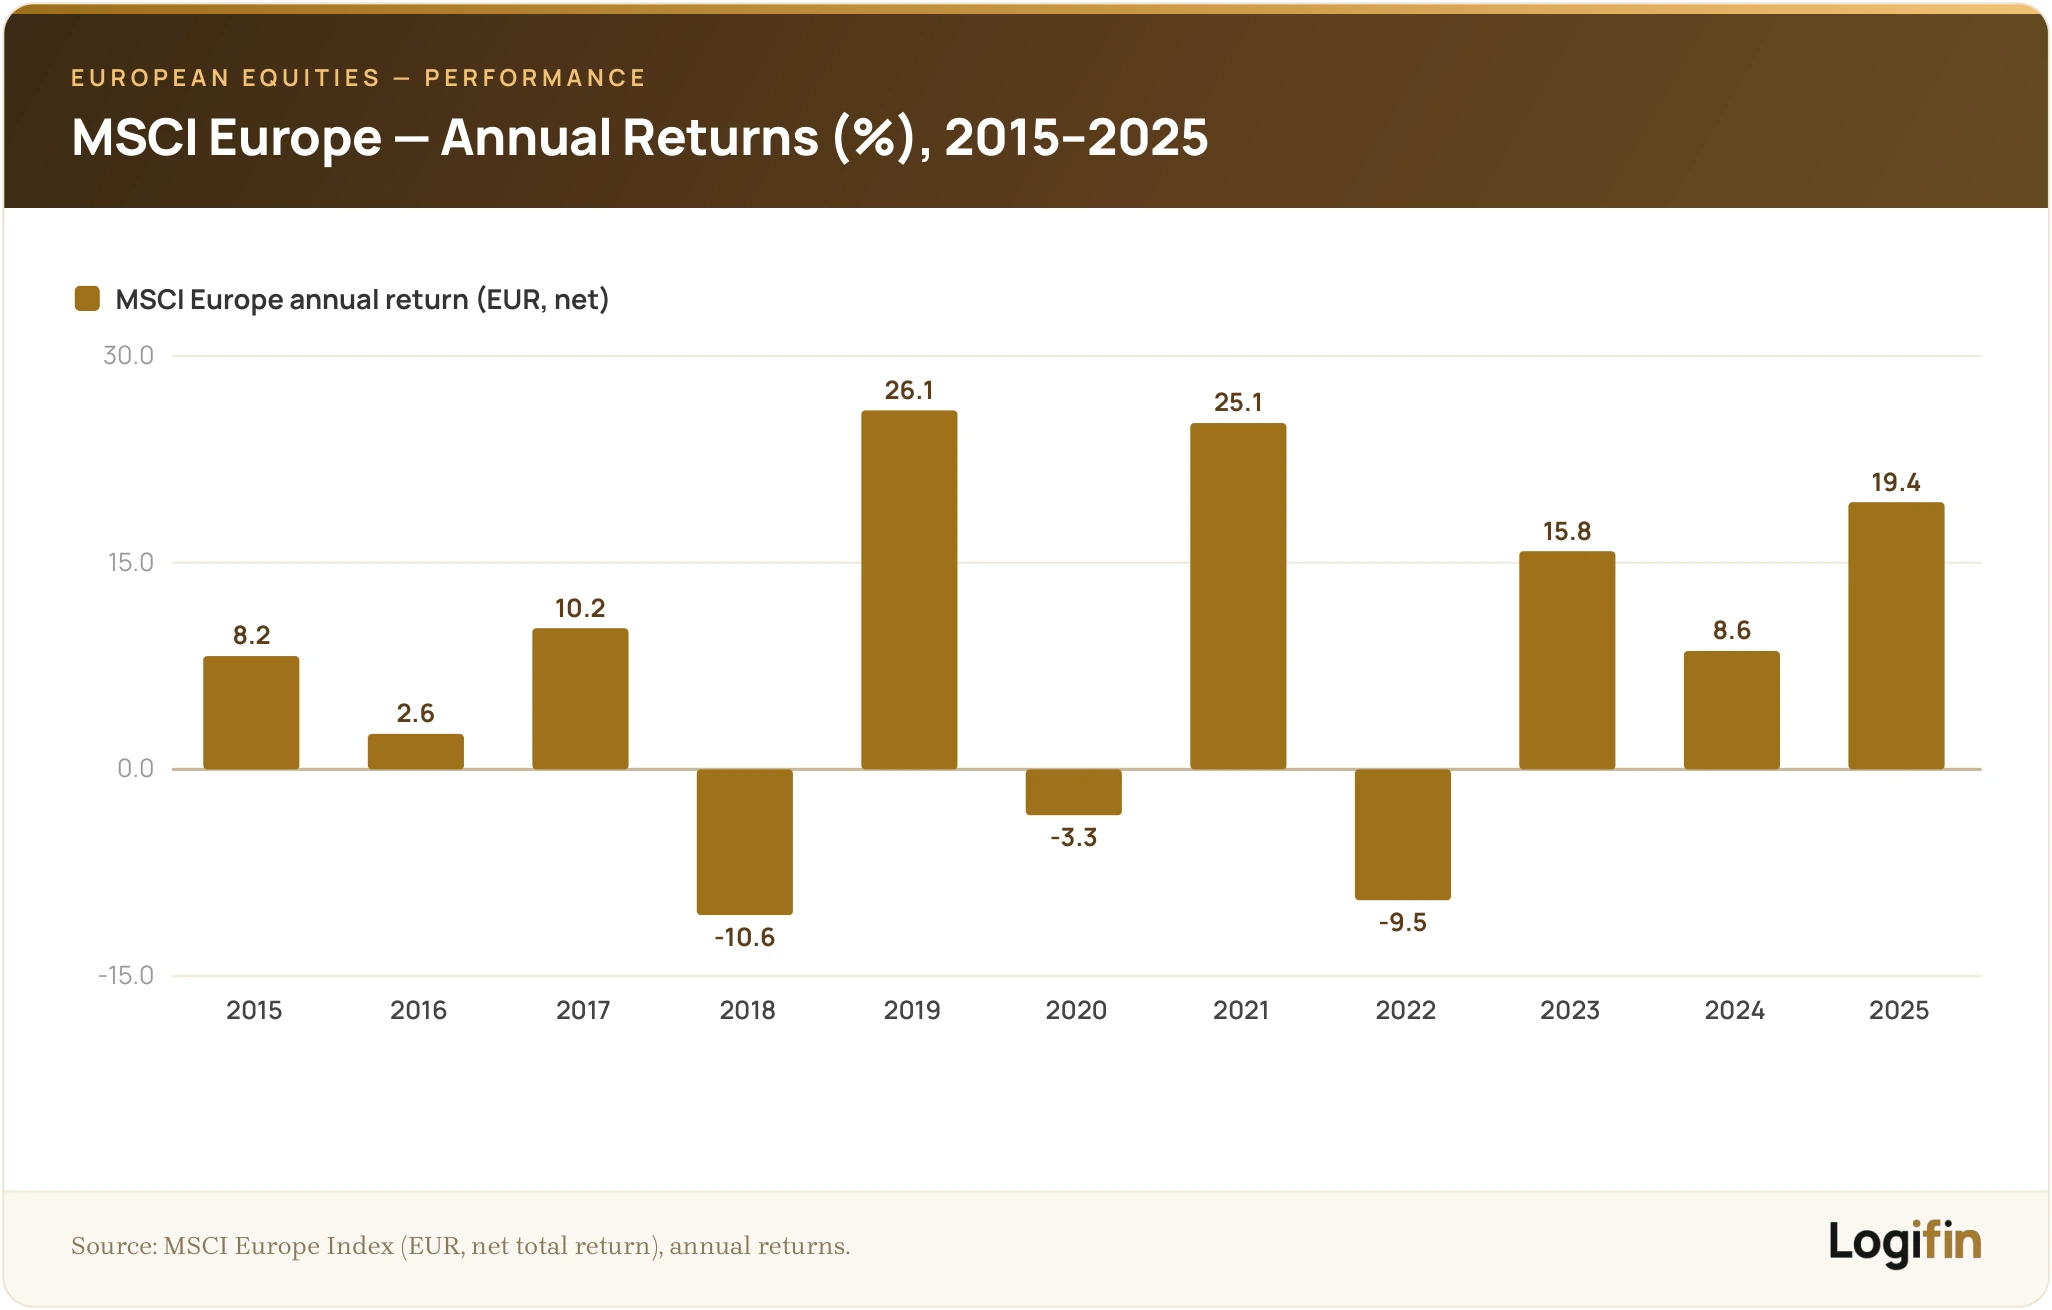
Europe has underperformed the US over the 2010 to 2025 period. That is clear. The MSCI Europe had:
- Lower technology exposure
- More regulation and slower growth
- Structural problems in the banking union, fiscal integration and geopolitical cohesion
However:
- European stocks are cheaper on metrics such as P/E or P/B
- Dividend yields are higher (~2.5–3.5% vs ~1.2–1.5% in the US)
- Many analysts consider it a “value play” for the coming decade
🔶 Global market (ACWI): The middle path
The MSCI ACWI (All Country World Index) is one of the most balanced solutions for global exposure, because it combines both developed and emerging markets in a single index.
Its geographic allocation reflects the real weight of the global economy and evolves gradually over time.
The index includes approximately:
- ~63–64% US. The strongest and most mature market in the world, with a large weight in technology and blue-chip companies.
- ~20% Europe + Japan. Markets with solid fundamentals, high transparency and a strong industrial base.
- ~10–15% Emerging markets, depending on the period. A small but meaningful participation in emerging economies that add growth potential.
Its performance sits between the two extremes:
- It is more balanced and less concentrated than the S&P 500.
- It is “slower” in bull markets that strongly favour technology.
- It does not reach the explosive growth of the Nasdaq or pure US indices.
- But it also does not show the same volatility, especially during corrections.
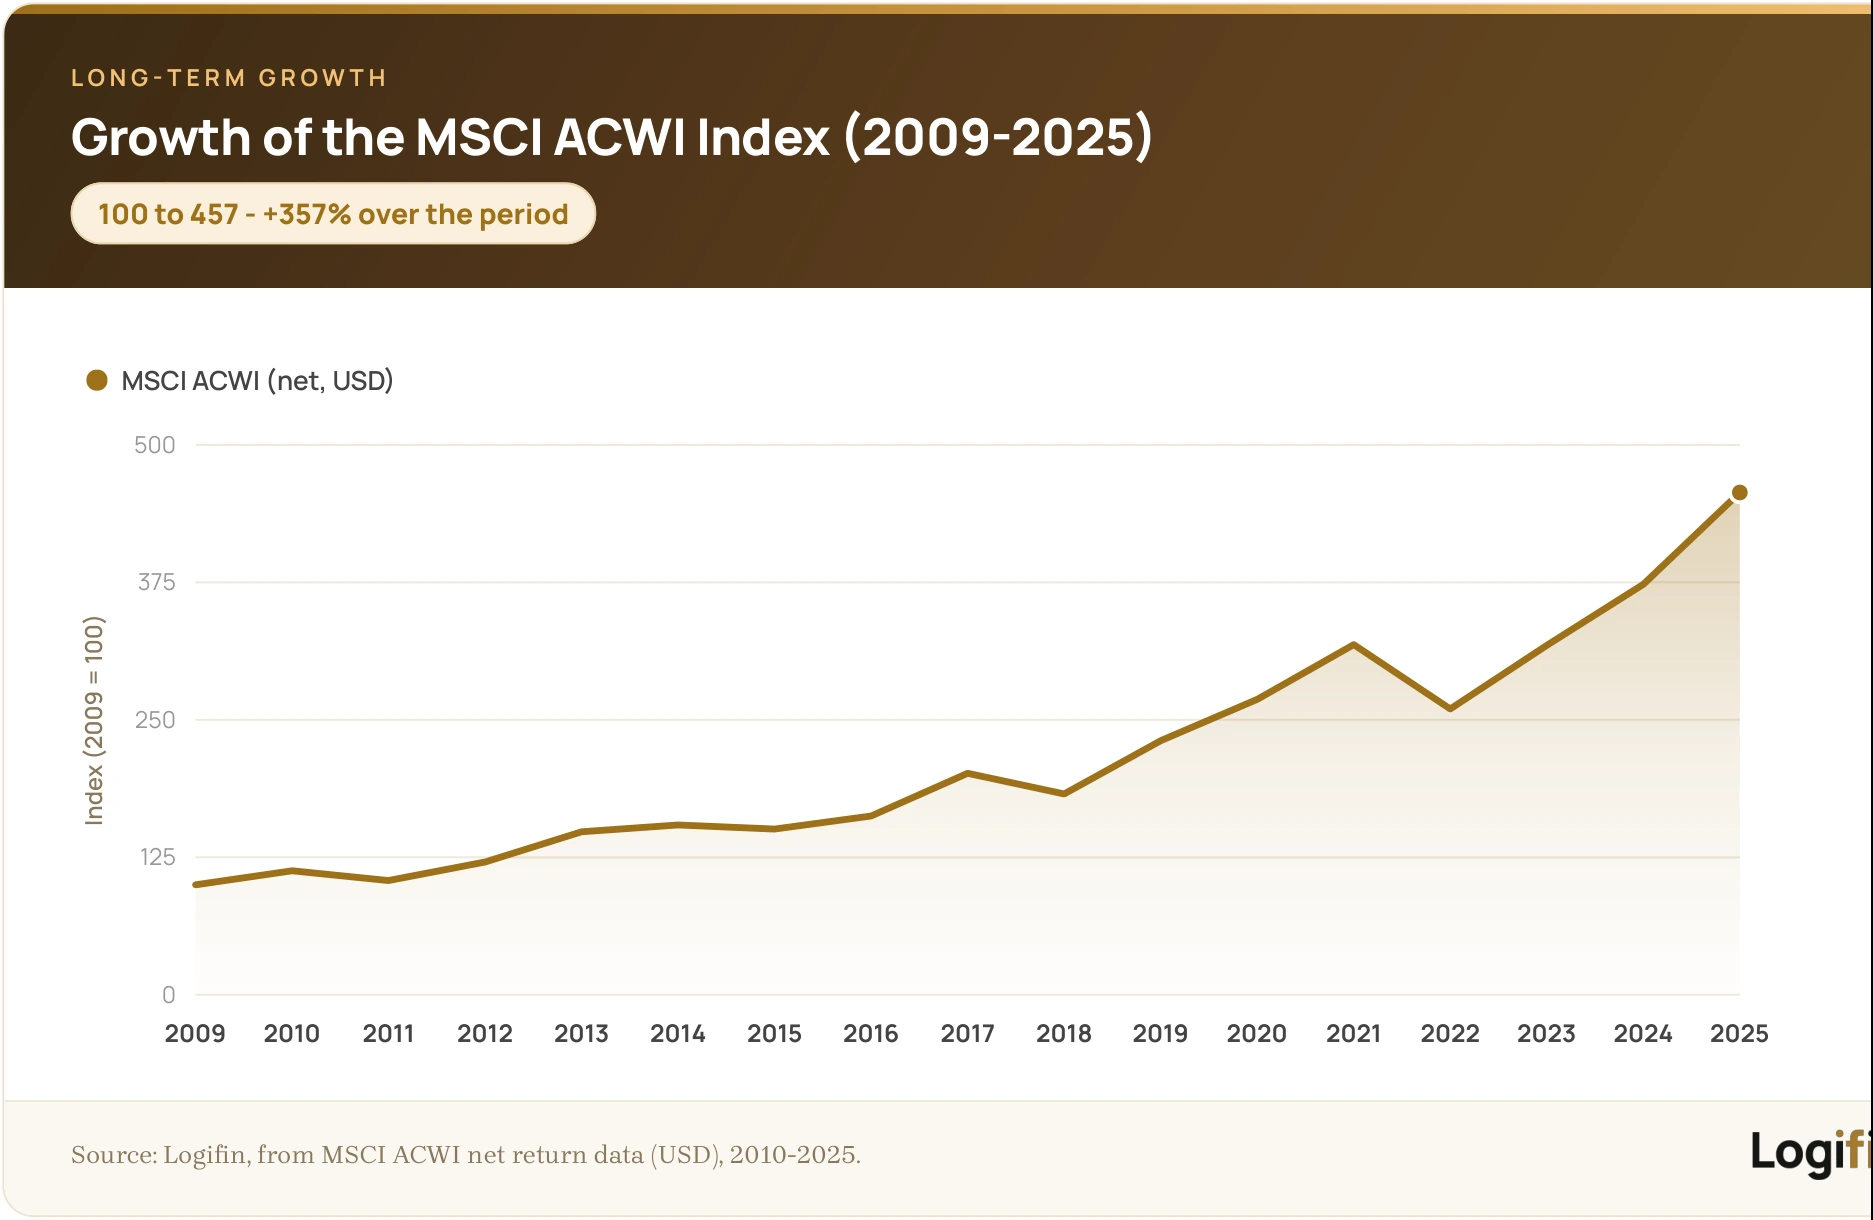
In other words, the ACWI acts as the “golden mean” between the stability of developed markets and the dynamism of the emerging ones.
It is ideal for investors who want simple, clean and fully global exposure without doing rebalancing or making complex choices.
🔶 The role of currency (EUR vs USD)
The currency you invest in is not a detail. It can boost or reduce your final return, even when the index itself moves in a different direction.
For European investors, the EUR/USD relationship is the single most important external factor affecting the returns of US ETFs.
- When the dollar strengthens, the returns of US ETFs in euros are boosted. The gain from the exchange rate is added to the index return and “softens” any declines.
- When the dollar weakens, the opposite happens. The exchange rate removes part of the return, even if the index itself moves up or stays flat.
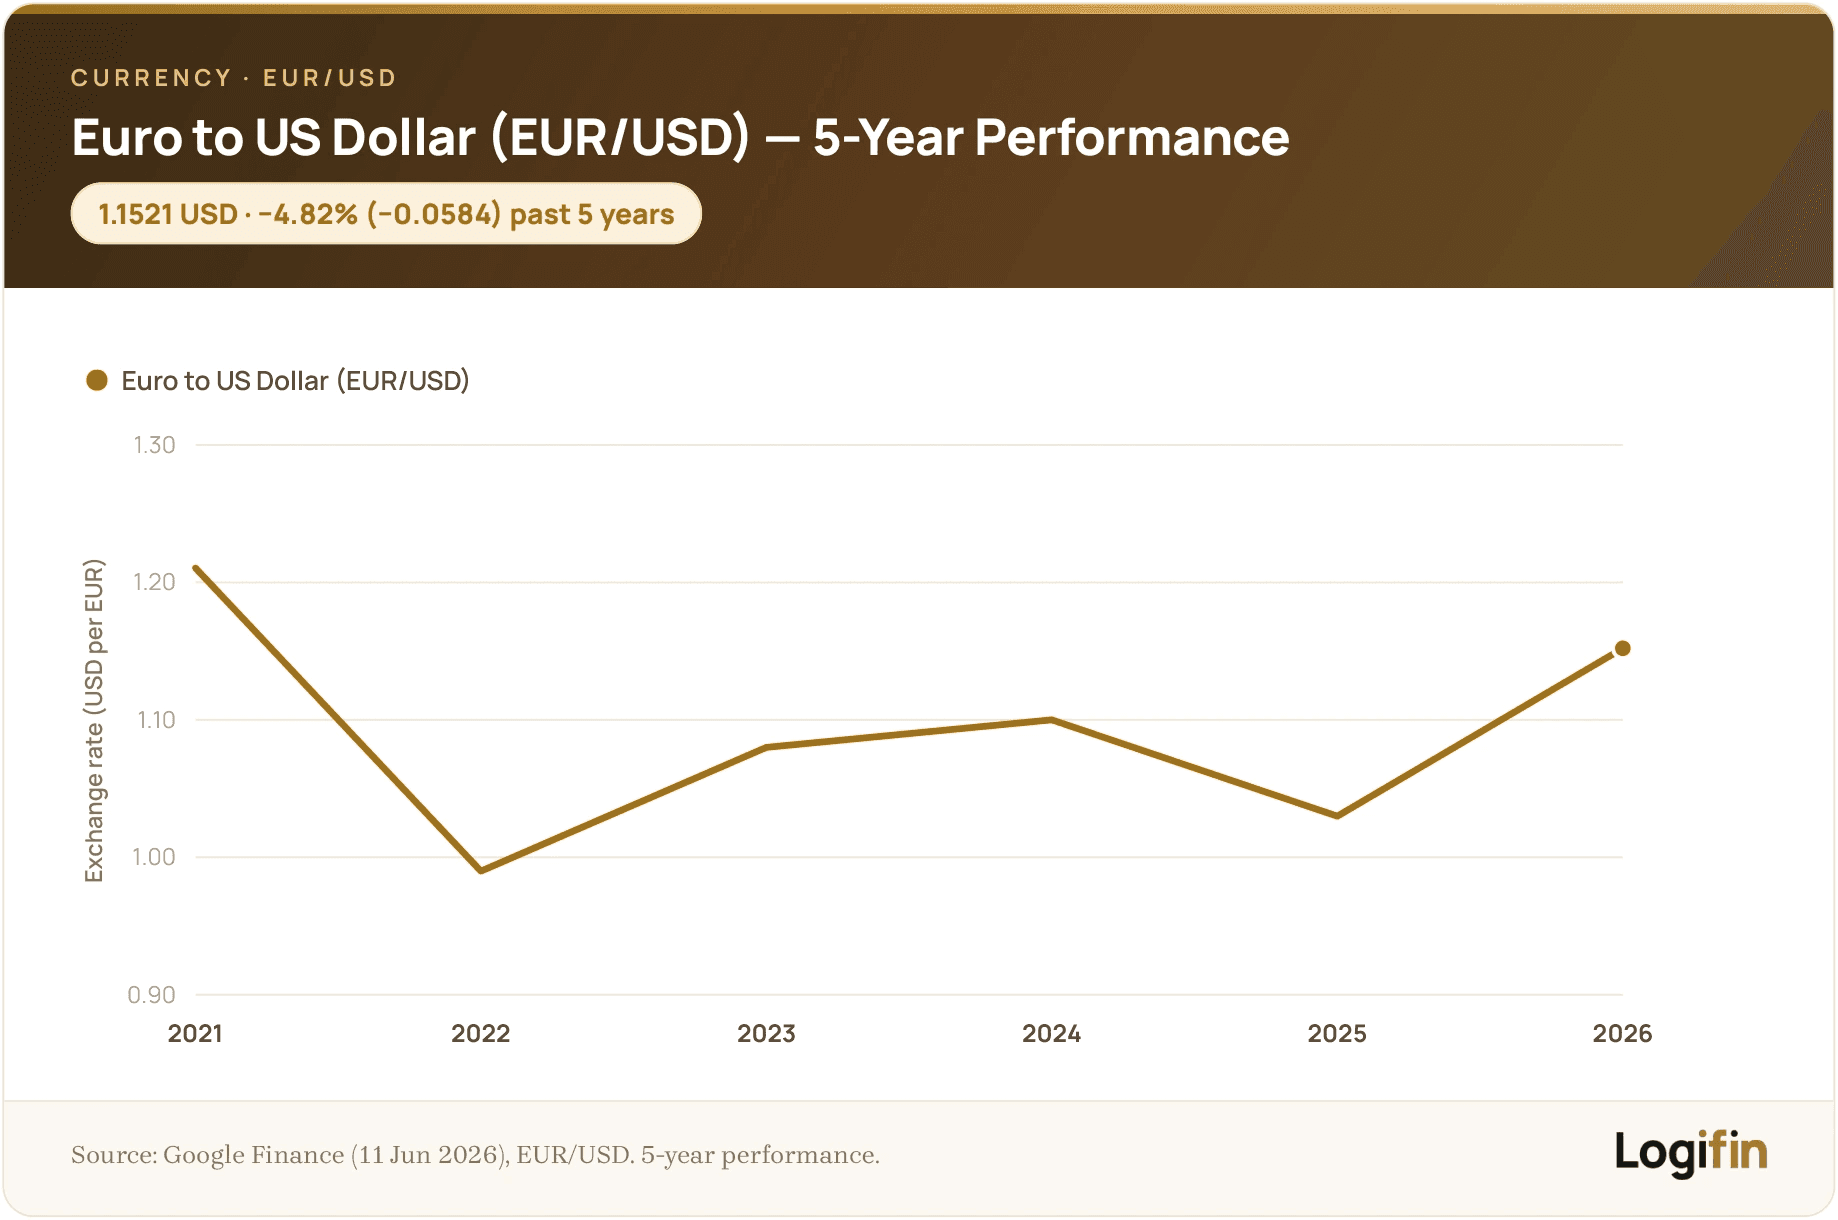
This means a European investor must take FX risk into account, especially when their portfolio is 70%+ in USD assets.
Which geographical allocations do European investors usually follow?
More and more Europeans choose ETFs to build their portfolio.
This means that the strategy examples we see in practice are valuable: they show what thousands of investors across Europe do and how they approach geographic diversification.
Although there are hundreds of possible combinations, the following are among the most widespread.
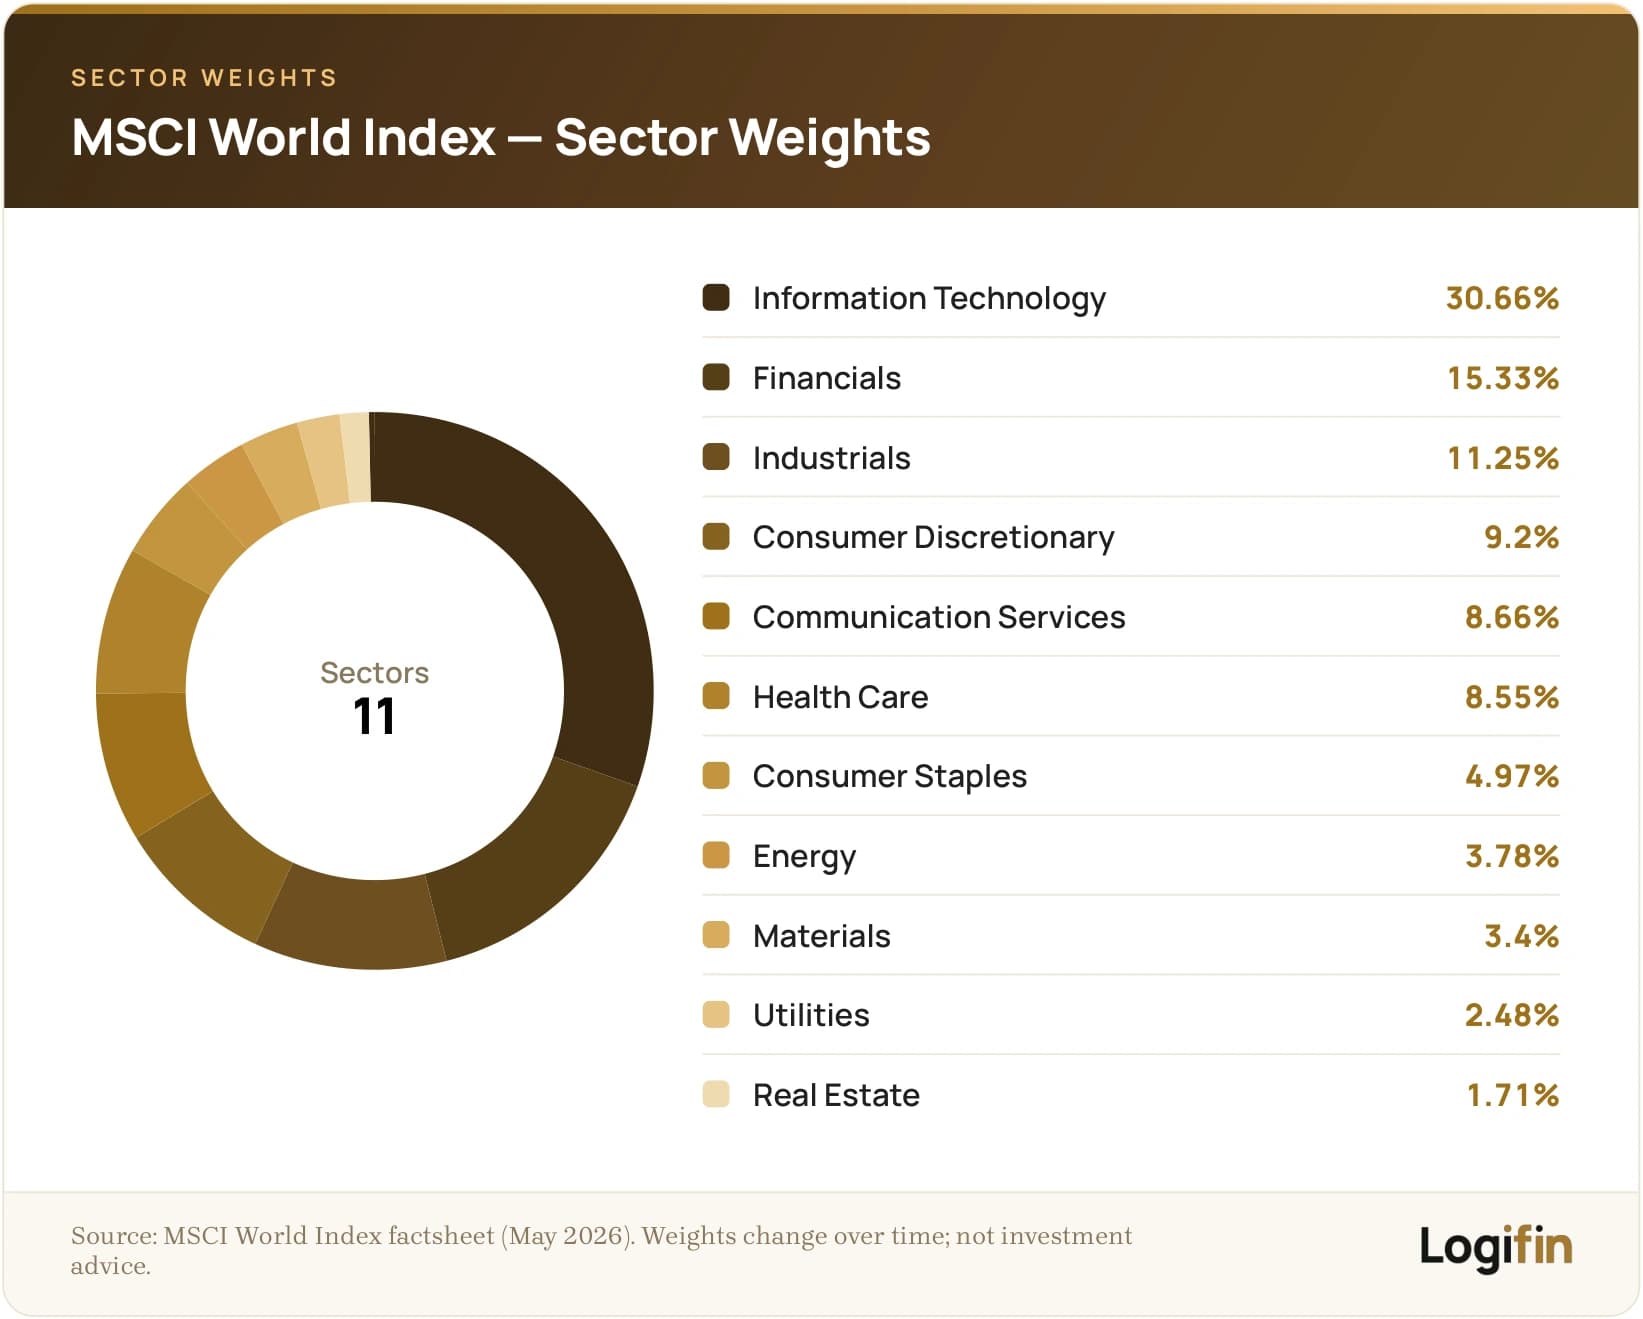
🔶 Strategy 1: 100% Developed (MSCI World or S&P 500)
What it is:
- It is a strategy where the entire portfolio is invested exclusively in developed markets.
- It uses indices with proven historical stability and broad diversification.
What it includes:
- It usually relies on the MSCI World or only the S&P 500 as the single core ETF.
- Both indices cover high-quality, large-cap companies from mature economies.
Who it suits:
- new investors who want to start with an absolutely simple solution
- those with lower tolerance for the risk of emerging markets
- investors who prefer ETFs with high liquidity, transparency and stable historical behaviour
Advantages:
- Simplicity, stability and a strong performance track record.
- This strategy is easy to manage and fits perfectly with long-term DCA.
Disadvantages:
- It offers no exposure to faster-growing economies.
- For investors who want growth momentum beyond developed markets it may feel limiting.
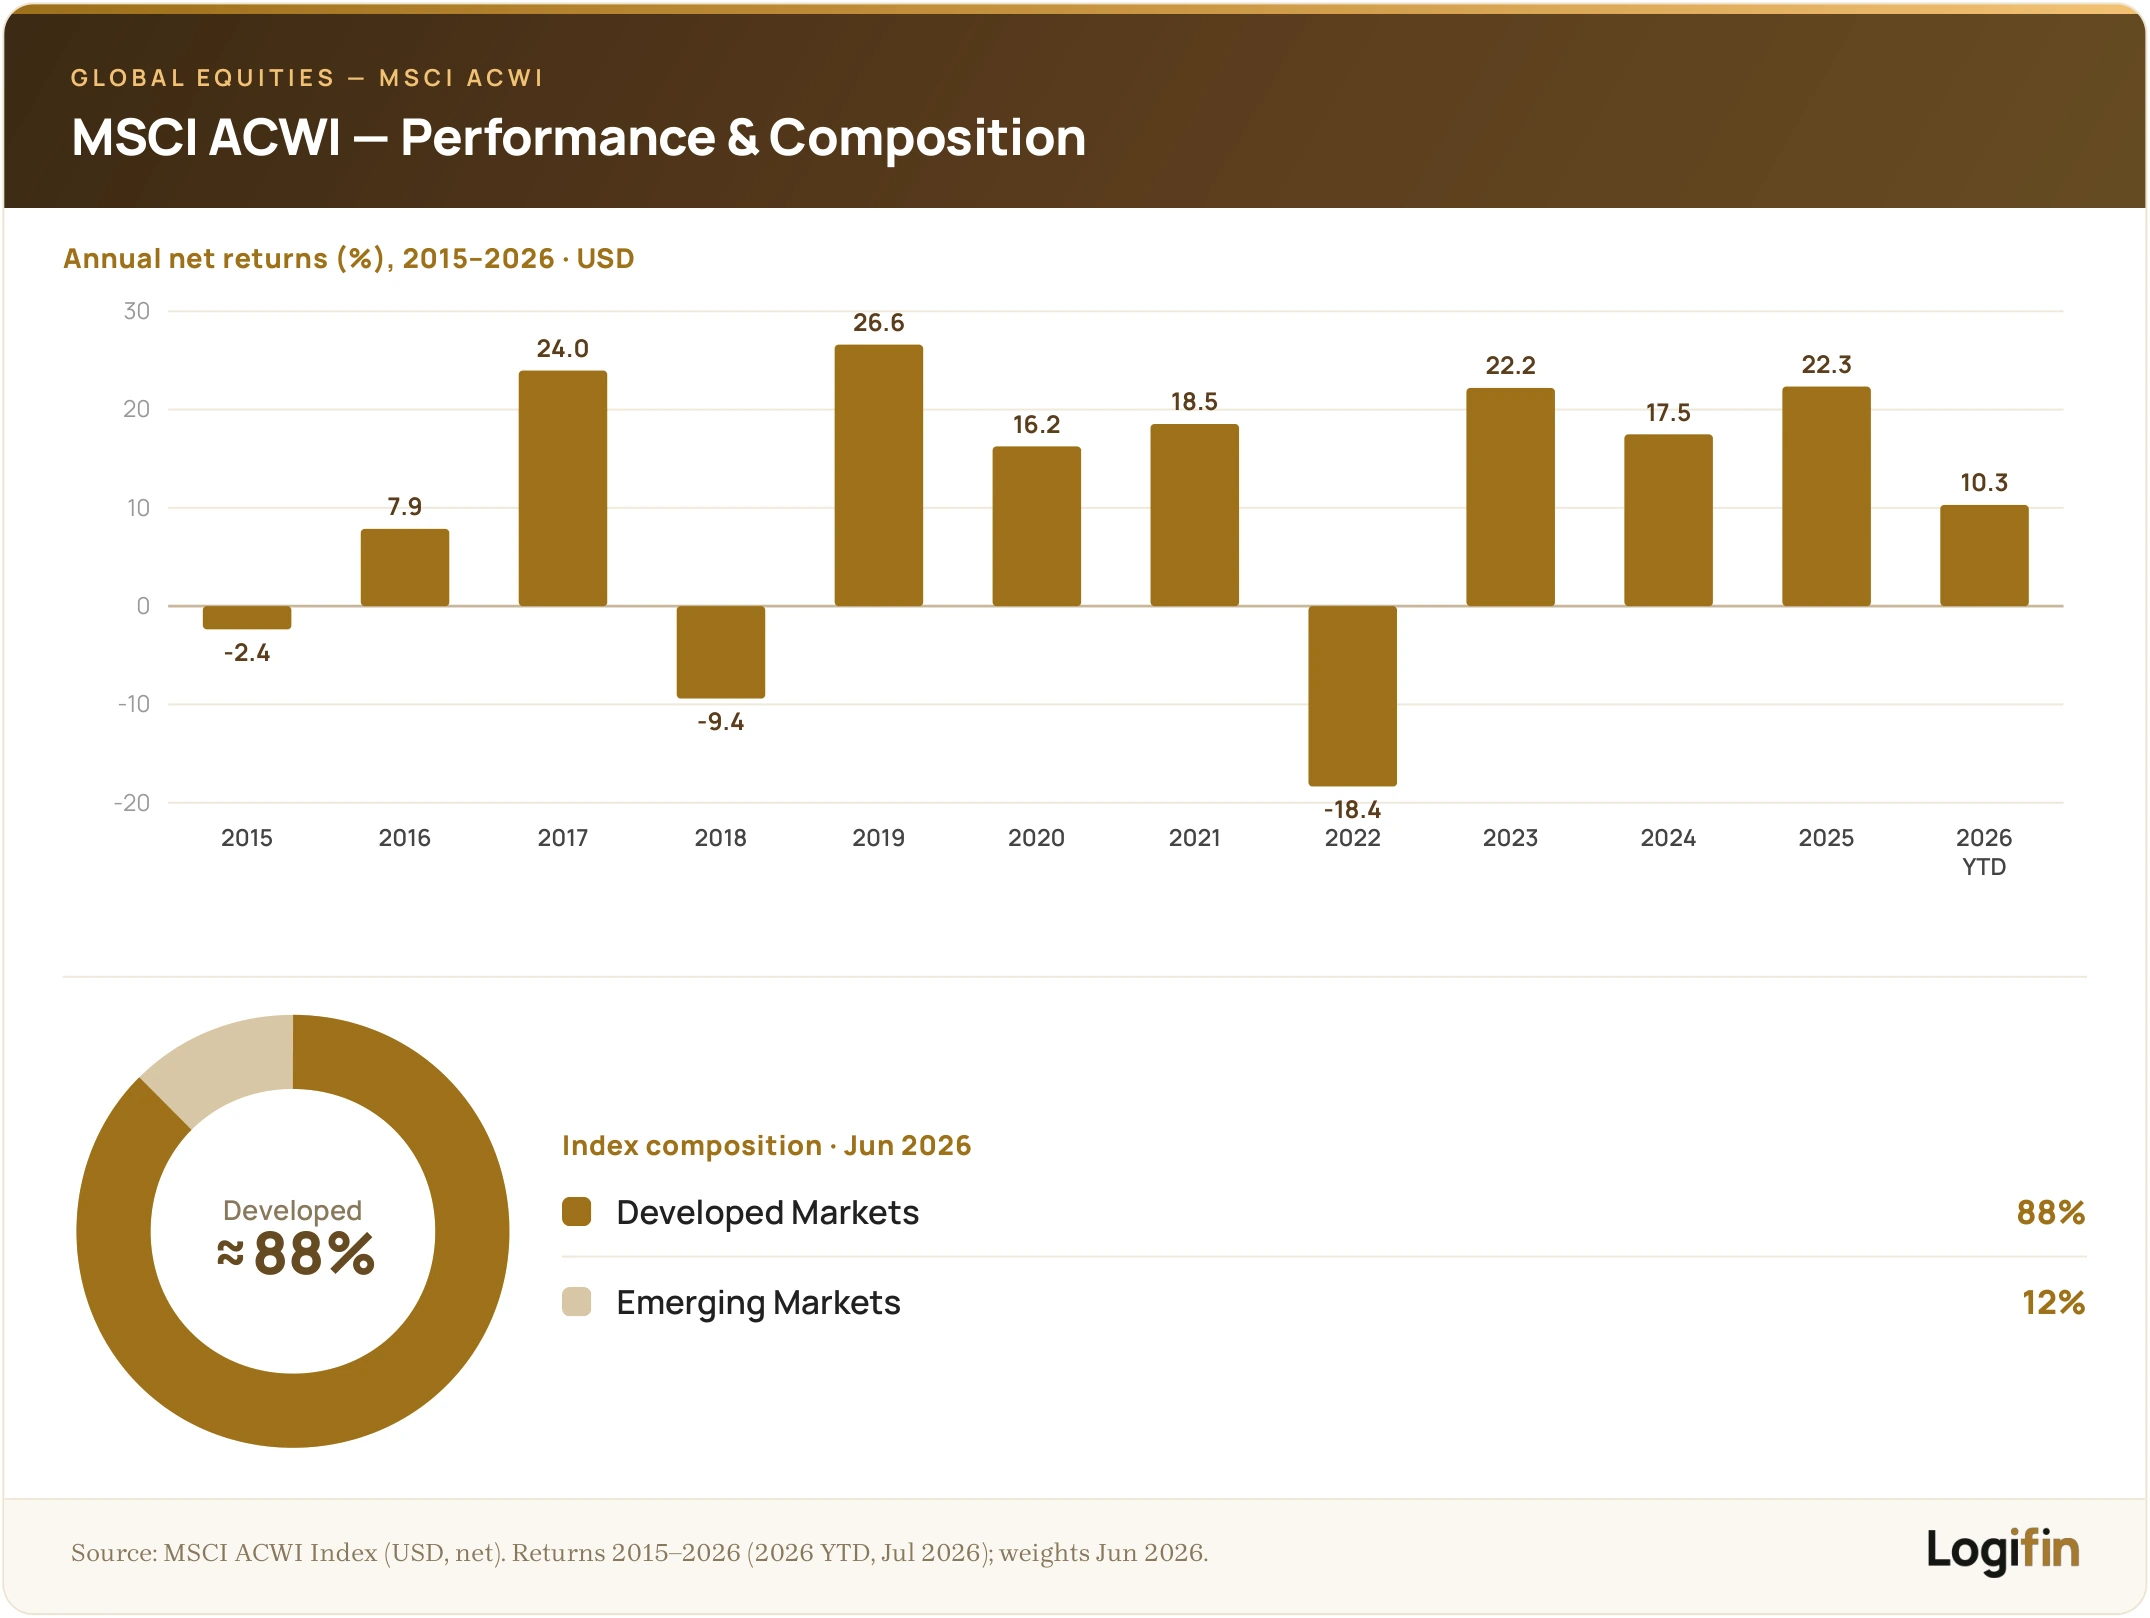
🔶 Strategy 2: MSCI ACWI 100% (1 ETF, Global exposure)
What it is:
- A strategy based on a single ETF that automatically combines developed and emerging markets.
- The MSCI ACWI gathers the global investable market into one product, without the need for two separate ETFs.
Allocation: About 88% Developed and 12% Emerging Markets, with small changes depending on the period and MSCI’s revisions.
Who it suits:
- those who want truly “the whole world” in one ETF without extra worries
- investors with limited time or who do not want to do rebalancing
- those who value the simplicity and clean structure of a single product
Advantages:
- You cover 47 countries and almost the entire international market with a single ETF.
- You do not need to track ratios, no rebalancing is required and the user experience is extremely simple.
Disadvantages:
- You cannot adjust your exposure to Emerging Markets.
- The EM participation stays relatively small and does not grow, even if you want more growth or a more aggressive profile.
🔶 Strategy 3: 80% Developed / 20% Emerging
What it is:
- A more “hands-on” approach based on separate ETFs for developed and emerging markets.
- It is usually implemented with a combination of IWDA (MSCI World) and EIMI (MSCI Emerging Markets).
- The investor sets the ratio themselves, creating a global portfolio with increased EM exposure.
Who it suits:
- those who want more control over their exposure and do not want to be limited to the ACWI’s ~12% EM
- investors who believe in the long-term potential of emerging economies
- those who apply DCA and tolerate the increased swings that come with EM
Advantages:
- It offers flexibility and the potential for higher upside, especially if emerging markets enter a period of outperformance.
- The investor can adjust the ratio according to their goal and increase the portfolio’s growth bias.
Disadvantages:
- It requires consistency in rebalancing, which is not always easy in periods of high volatility.
- It takes persistence, especially when emerging markets go through prolonged bearish phases.
🔶 Strategy 4: Core Developed + Satellite Thematic / EM
What it is:
- A flexible and more “alive” strategy that rests on a strong core of developed markets and is complemented by targeted positions in emerging or thematic investments.
It usually includes:
- 70–80% in core Developed ETFs such as MSCI World or S&P 500
- 10–20% in EM or thematic ETFs such as AI, Clean Energy, India, Cybersecurity, etc.
This way the portfolio stays stable at its base, while at the same time gaining growth momentum in sectors or regions you consider promising.
Who it suits:
- those who want the stability of a core ETF, but also the potential for targeted growth
- investors who follow the markets and want a more flexible structure
- those who combine DCA in the core with more strategic rotation in the satellite part
Advantages:
- It offers dynamism, higher adaptability and the ability to lean into specific market trends.
- It also lets you express your personal convictions without disrupting the core portfolio.
Disadvantages:
- Management becomes more complex and requires attention to overlap between ETFs and to excessive risk concentration.
- It takes greater discipline so the satellite part does not turn into an uncontrolled pile-up of thematic picks.
Common geographic-allocation mistakes — and how to avoid them
Geographic allocation is one of the most misunderstood parts of building a portfolio.
Especially for a European investor, bombarded with American examples, it is easy to reproduce “models” that do not fit their own reality.
Let us look at the most common mistakes and how to avoid them without sacrificing simplicity.
🔶 Overexposure to the US… without realising it
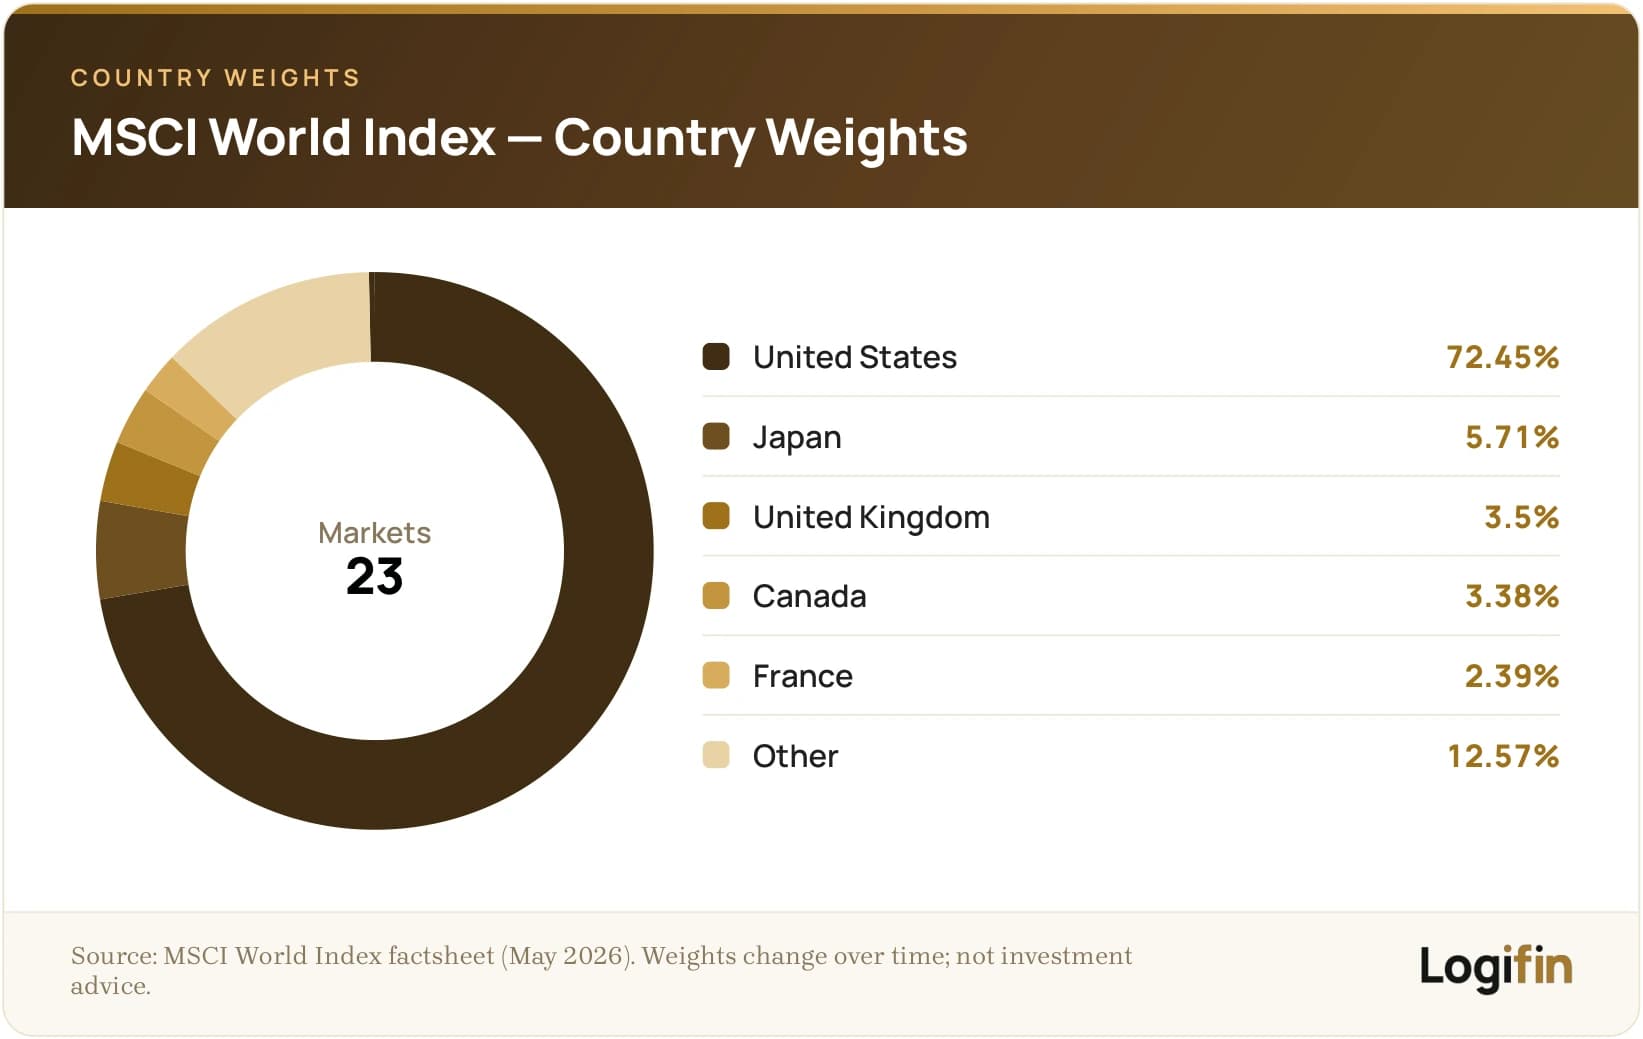
Many investors choose an index such as the S&P 500 (VUAA, SXR8, CSP1, etc.) or the MSCI World, believing they have built a globally diversified portfolio.
The reality, however, is different. Because of the structure of these indices, their final US exposure ranges between 60 and 80%, something that is often not obvious at first glance.
This happens because of:
- The composition of the indices themselves. The largest and most valuable companies in the world are American, so they dominate by market cap.
- The overlap between multiple ETFs. If your portfolio holds S&P 500 + World + Nasdaq 100, then US exposure shoots up even more.
- The lack of geographic or thematic complements. Without EM, Europe or other regional markets, the allocation becomes over-concentrated in the American economy without you intending it.
🔶 No exposure to Europe or emerging markets
For an investor who lives and spends in euros, zero exposure to the European economy can create:
- Currency risk (EUR/USD)
- Reduced stability during crises within Europe
- Disconnection from the local economic reality
Also, the complete absence of emerging markets (EM) removes the chance to take part in long-term growth cycles (e.g. India, Indonesia, Vietnam).
🔶 Multiple ETFs with overlap
One of the most common (and most insidious) mistakes in geographic allocation is unintentional double exposure to the same markets.
This happens when you add multiple ETFs that, despite their different names, have almost the same composition.
A classic example:
- You hold IWDA (an ETF that tracks the MSCI World index)
- You add VUAA (an ETF that tracks the S&P 500 index)
- And you think that with an ETF tracking emerging markets you “complete the puzzle”
In practice, however, the picture is very different:
- VUAA is already inside IWDA, since the MSCI World has roughly 72% US exposure and includes almost all the large S&P 500 companies.
- By adding VUAA separately, you double your exposure to US stocks, often without realising it.
The result? The geographic balance you thought you were achieving is cancelled out.
Instead of global diversification, you end up with a portfolio over-concentrated in the US, which increases risk and reduces the variety of investment patterns you are exposed to.
🔶 Ignoring currency risk
When 70–90% of your portfolio is in USD-denominated assets (e.g. S&P 500, Nasdaq 100), but your income, obligations and needs are in EUR, then you have systematic currency risk.
This means:
- Exposure to a depreciation or strengthening of the dollar
- Uncertainty in your real return in euros
- Possibly increased instability during periods of currency volatility
You do not necessarily have to “hedge”. But you must be aware of it and weigh it when you choose your investment strategy.
🔶 An over-complex allocation for no reason
Having:
- 3 Developed World ETFs
- 2 Emerging Markets ETFs
- 1 ETF for the Japanese market
- 1 ETF for the Indian market
- 2 thematic ETFs
- and different tickers per platform…
…does not make you a smarter investor: it makes you a portfolio manager without a strategy.
Excessive complexity:
- Makes monitoring harder
- Causes unnecessary overlap
- Increases the psychological barriers to adjusting
Keep things as simple as needed, not just “as simple as possible”.
How to build a geographically balanced portfolio as a European investor
The geographic allocation of your portfolio is not a technical detail: it is one of the most decisive choices you will make.
It determines:
- Which economies you trust with your future
- Which currency affects your returns
- And how your investment will behave in crises or growth phases
Let us see how you can approach geographic balance with strategy.
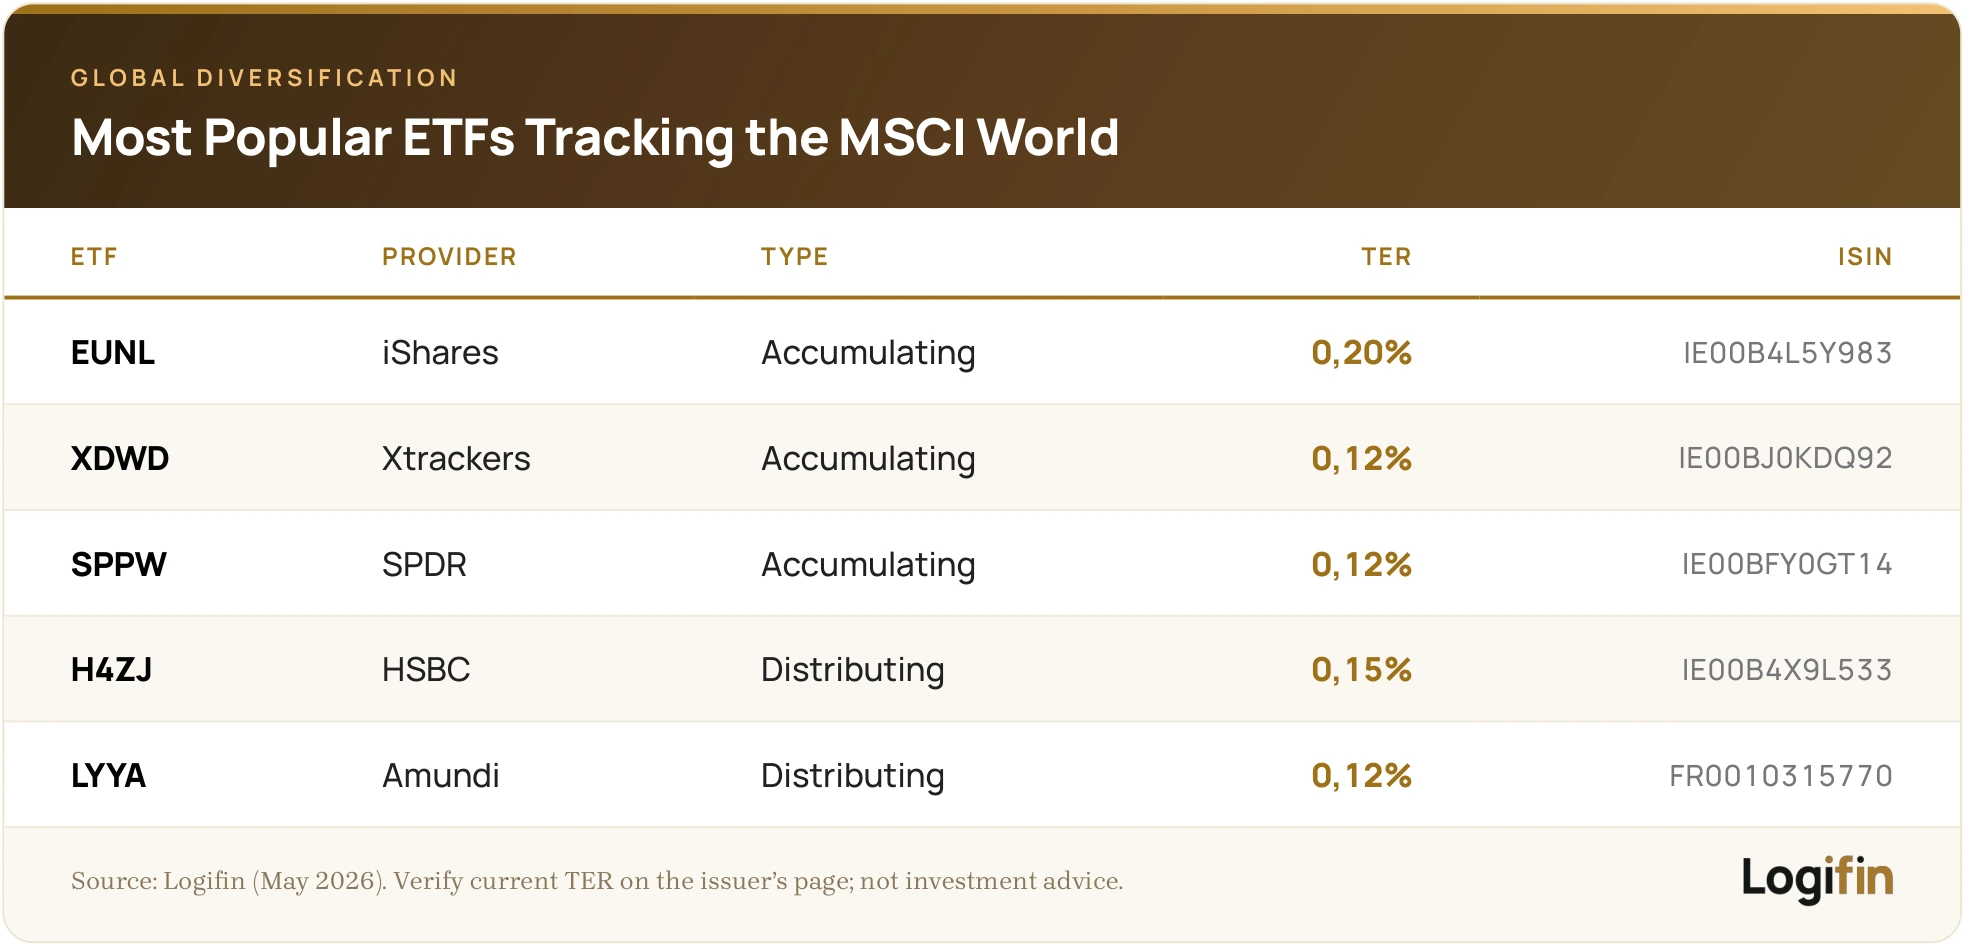
1. Define the Core of your portfolio
The “Core” is the stable base of your portfolio, 70–90% of the capital. Popular options:
- MSCI World | Developed Markets across the world
- MSCI ACWI | Developed & Emerging Markets across the world
- S&P500
- Combinations such as S&P 500 + Europe ETF
As a European investor, look for the UCITS versions of these indices: they trade on European exchanges, often directly in euros, while they comply with the European investor-protection framework.
2. Add “satellite” components (Satellite)
If you want to add a bit more personality and diversification to your portfolio, you can add:
- an ETF that includes emerging markets
- an ETF focused on strategic markets (e.g. India)
- Eurostoxx 50 or MSCI Europe to boost euro exposure and dividends
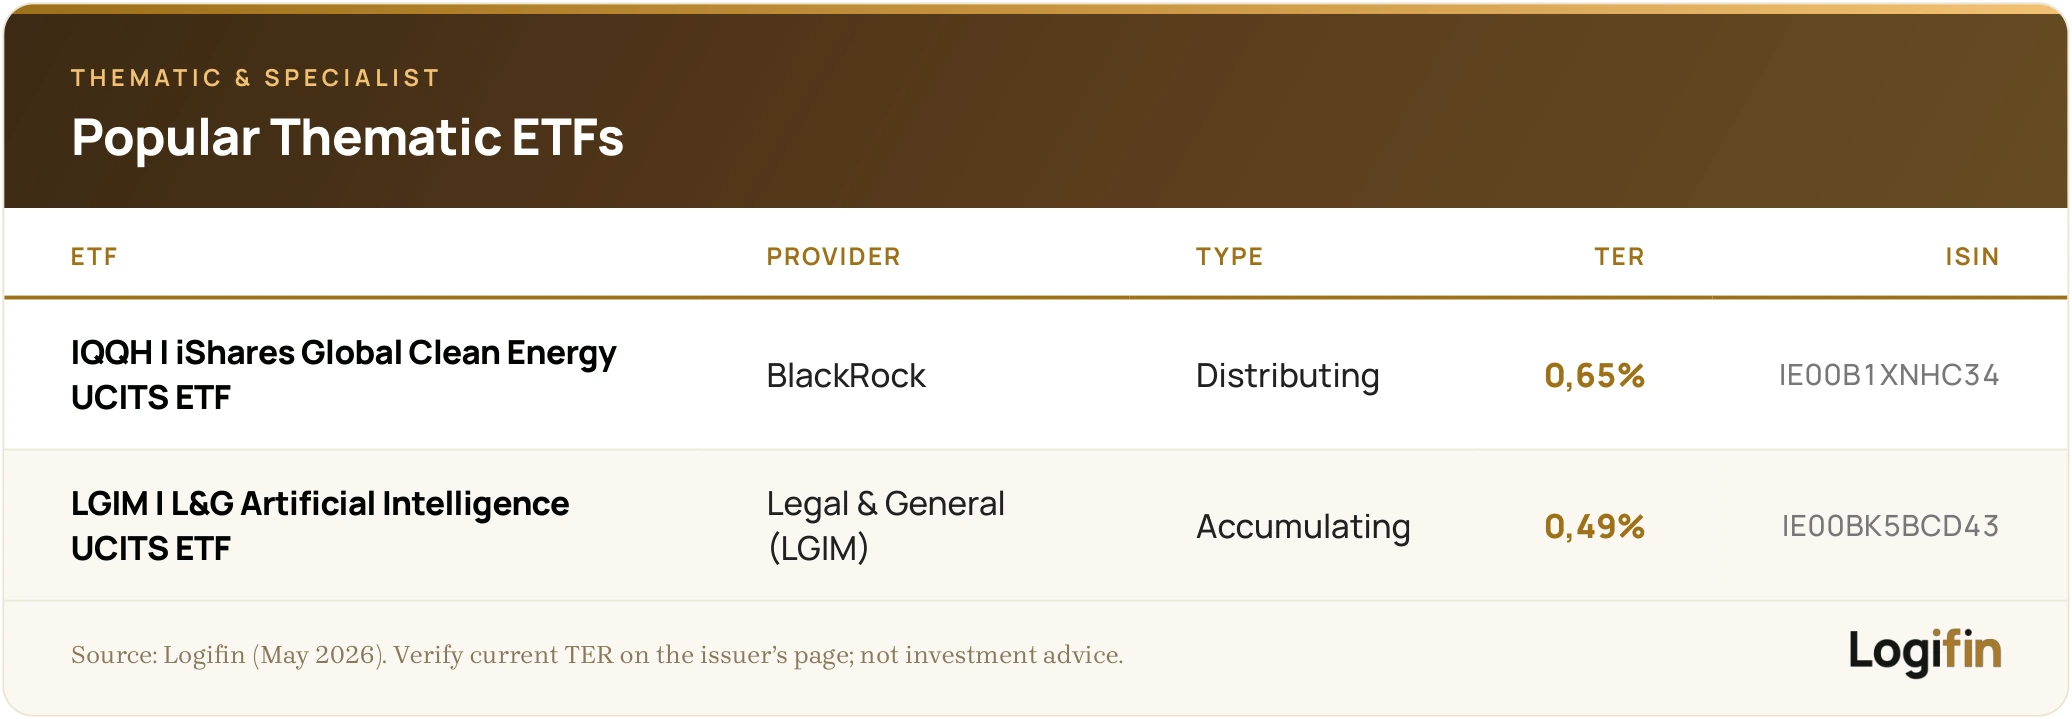
- a thematic ETF (AI, Clean Energy, etc.)
Tip: If you are a beginner, start with a single satellite ETF (10–15%) and watch it for 6 months.
Just keep in mind that thematic ETFs usually carry higher annual costs (TER) and bigger swings, which is exactly why they belong in the "satellite" part, not the core.
3. Set your target (weight per region)
Possible variations:
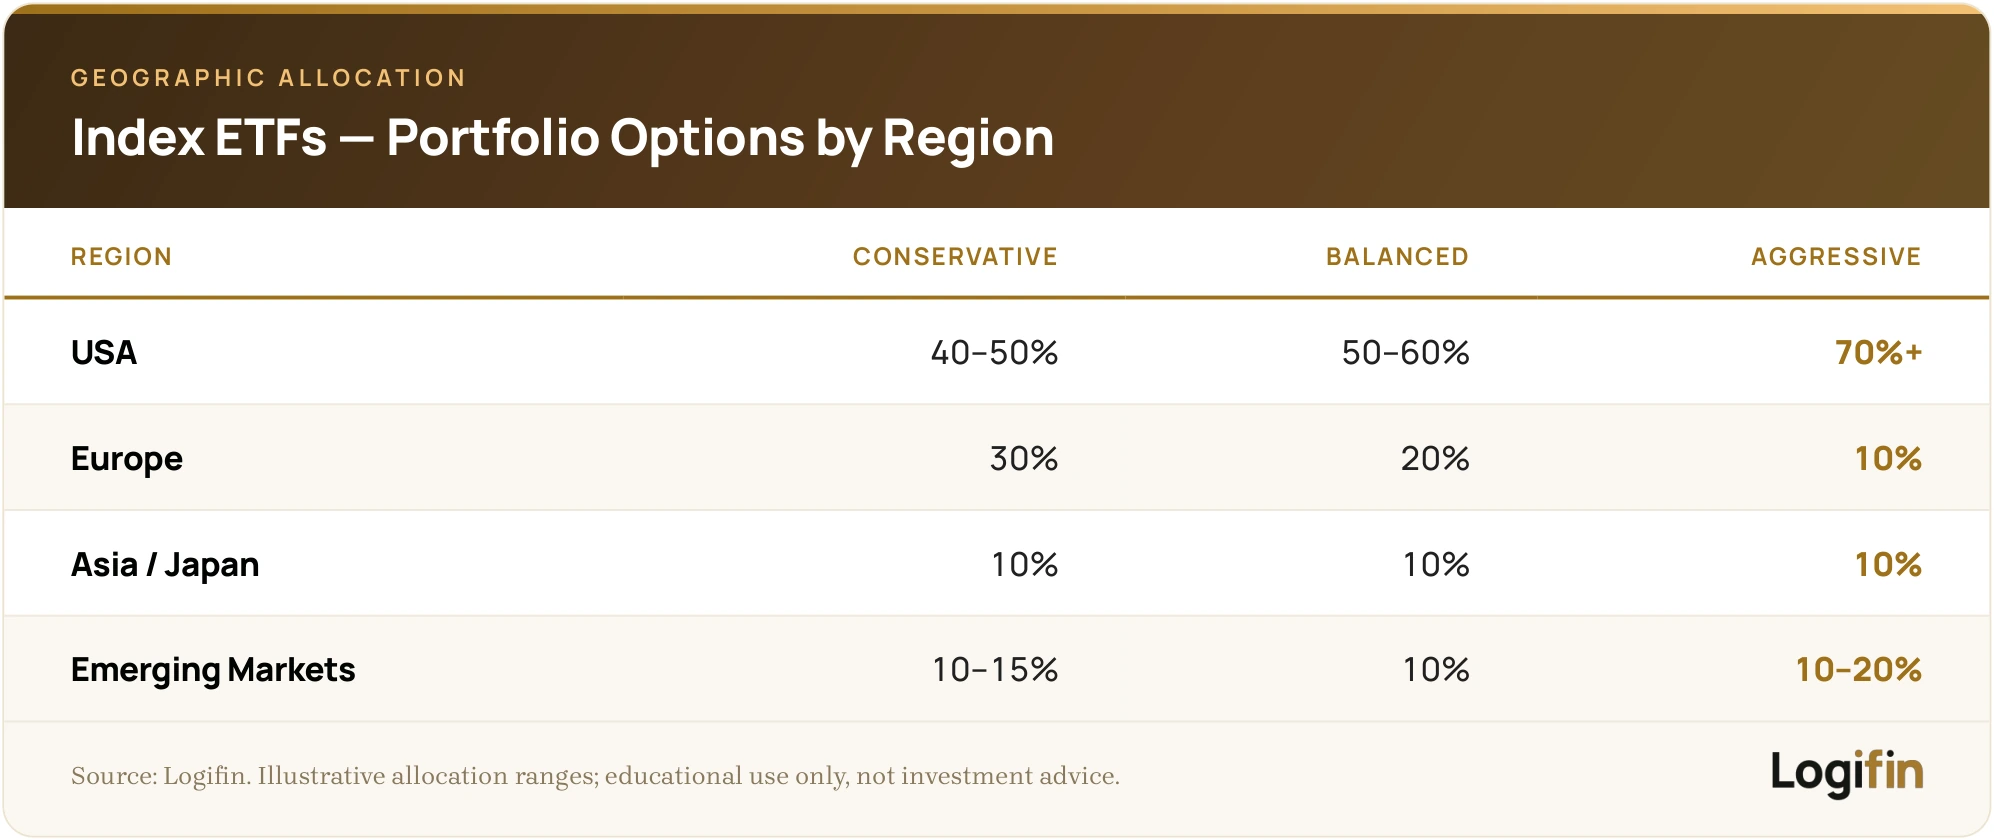
There is no single "right" allocation for everyone: each region’s weight depends on your time horizon, your risk tolerance and how much dollar exposure you are comfortable holding.
What matters is writing your choice down and staying close to it with your new contributions.
Conclusion and practical takeaways
Geographic allocation is one of the most decisive choices you will make as an investor, often more important than picking a specific ETF.
As a European investor, you do not need to copy the "American" playbook: your needs, your currency and your risk profile are different.
🔑 Key takeaways:
- Your expenses are in euros, so your exposure to the US dollar creates currency risk you should not ignore.
- US outperformance over 2008–2023 is a historical fact, not a guarantee for the future.
- A broadly diversified global ETF (e.g. MSCI World or MSCI ACWI) offers ready-made geographic diversification in a single product.
- The biggest risk is usually not the "wrong" allocation, but unknowingly being overconcentrated in the US and the overlap between your ETFs.
Practical Tips:
1️⃣ Build your core first: Many investors choose a global ETF as the base of their portfolio (70–90%) and add satellite positions (10–20%) only when they serve a specific purpose.
2️⃣ Measure your real exposure: Add up the geographic breakdown of every ETF you hold. You may discover you are 60–80% US while believing you are diversified.
3️⃣ Avoid duplicate positions: Before adding a new ETF, check whether it covers markets you already own: overlap is not diversification.
4️⃣ Keep it simple and stay consistent: Set target weights per region, keep up your DCA and rebalance once a year instead of chasing whichever region is "hot".
The content of this article is provided exclusively for informational and educational purposes and does not constitute investment advice or a recommendation to buy or sell financial products. The information is based on publicly available sources considered reliable, without any guarantee of accuracy or completeness. Before making any financial or investment decision, it is recommended that you consult a certified professional advisor or accountant, taking into account your own financial situation and risk profile. The Logifin team bears no responsibility for any direct or indirect damages arising from the application of the information presented.
Related articles

Developed or emerging markets? Which ETFs suit you best in the end?
The geographical allocation that can make the difference in your portfolio
17 min read

How to build a resilient portfolio
A guide for investors who want to build something stable, simple and rewarding over the long term.
19 min read

Investing in gold through ETCs: The complete guide
When does it make sense to add gold to your portfolio and which ETCs are worth considering?
15 min read

What is a recession and how it affects investors?
How a recession is defined, what causes one, how the markets usually behave during it and what an investor can do to prepare in advance.
24 min read
EXPLORE LOGIFIN
Everything you need in order to learn, plan and track your investments.
Logifin Blog
Learn everything you need to get your finances in order and invest with confidence.
Logifin Insights
What moves the markets and what it means for a long term investor. Short and without the noise.
Logifin Tools
Free, inside the site, no signup. Everything you calculate stays on your device.
Logifin ETF Hub
Find the ETF that fits you: 550+ UCITS ETFs, smart filters and in-depth comparisons.
Logifin Guides
A series of guides that builds your investment plan step by step. The first guide is free for everyone.
Logifin Circle
The tools and the Hub are free for everyone. You become a member for the intelligence that never stops.