Developed or emerging markets? Which ETFs suit you best in the end?
The geographical allocation that can make the difference in your portfolio
7 August 2025 · 17 min read

What do the terms developed and emerging markets mean?
Developed markets are mature, stable economies such as the US, Germany or Japan, while emerging markets are fast-growing economies such as China, India or Brazil, with a higher growth rate but also greater risk.
The distinction between developed and emerging markets is the foundation of every investment strategy built on geographic diversification.
🔶 What are developed markets?
Developed markets are economies that have reached a high level of maturity.
They have a strong institutional framework, a stable banking system, high per-capita income and developed capital markets that operate under predictable rules.
They are characterised by:
- Stable economic growth
- Strong institutions and a regulatory framework
- High liquidity and large-cap companies
- Lower political and currency risk
These countries have established democratic processes, predictable economic policies and stable currencies.
For example: the US, Canada, Germany, France, Japan, Australia, the United Kingdom, the Netherlands, Switzerland, Sweden and Singapore.
🔶 What are emerging markets?
Emerging markets are in a phase of accelerating economic growth, but have not yet reached the stability levels of developed markets.
They combine a higher growth rate with greater risk and uncertainty.
They are characterised by:
- Higher GDP growth rates
- Increased volatility and political or currency risk
- Demographic momentum
- The possibility of institutional intervention
For example: China, India, Brazil, Mexico, Poland, Indonesia, Turkey and the Philippines.
🔶 Who decides what counts as "developed" or "emerging"?
There is no single global classification system.
MSCI, FTSE Russell, the IMF and the World Bank use different criteria, often leading to different classifications.
Example: South Korea is developed for FTSE but emerging for MSCI.
This directly affects ETFs, since two "emerging markets ETFs" can have a different composition depending on the provider.
How have emerging markets performed historically compared to developed markets?
One of the most common questions a long-term investor asks is:
"Are emerging markets actually worth it? Do they perform better than developed ones?"
The answer is not that simple. Across different periods, returns and risk vary significantly. But by examining historical data, we can draw a few useful conclusions.
🔶 15-year performance (in EUR, total-return basis)
- Emerging markets have seen periods of impressive growth as well as long phases of underperformance.
- Their 15-year track record is full of cycles, which makes combining them with developed markets even more interesting for the long-term investor.

- When did emerging markets outperform?
Emerging markets had periods when they clearly outpaced developed markets, delivering high returns to investors who had exposure at the time.
2003–2007: The "golden cycle" of EM
- China, India and Brazil were growing rapidly, while commodity prices soared.
- It was an era of strong global demand, with emerging economies gaining significant ground against developed ones.
2009–2010: Rapid recovery after the 2008 crisis
- While developed economies were slowly healing from the financial crisis, many emerging markets rebounded much faster thanks to lower debt, younger populations and strong domestic demand.

- But why did they underperform over 2011–2020?
From 2011 through 2020, emerging markets moved noticeably weaker than developed markets. The main causes were:
- Political instability. Changes of government, geopolitical risks and institutional intervention often created uncertainty in the markets.
- A stronger dollar. A strong USD works against many emerging economies, raising debt-servicing costs and pressuring their currencies.
- Slow reform progress. In several EM countries reforms advanced slowly, limiting productivity and the appeal to foreign investment.
- Lagging technological innovation. Unlike the US, which dominates technology and the digital economy, many EM markets failed to keep pace, losing ground in global growth.
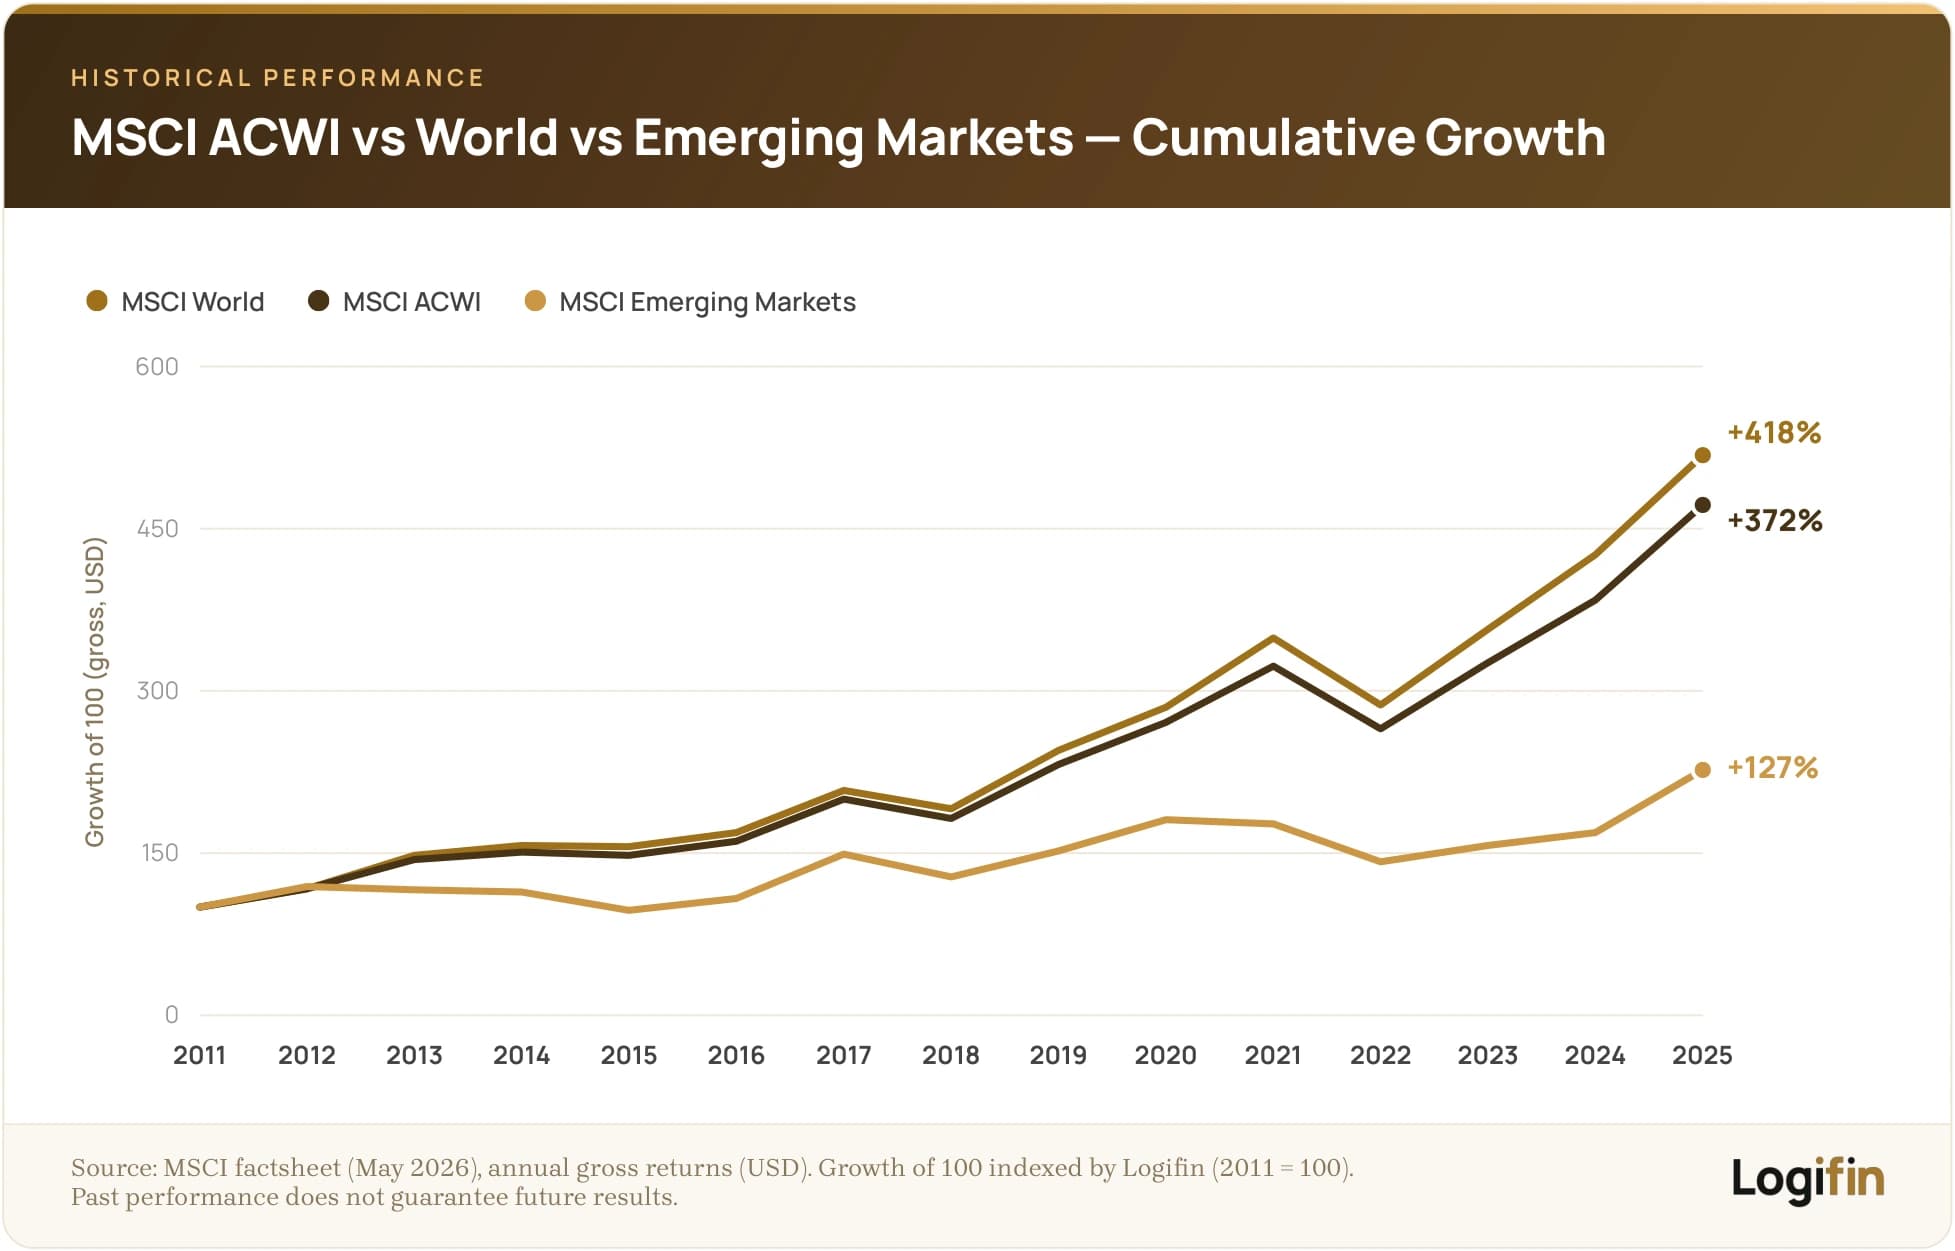
🔶 What does this mean in practice?
- Emerging markets can outperform developed markets, but only in specific cycles that are hard to predict.
- They are more sensitive to external factors (e.g. interest rates, trade tensions, exchange rates).
- Their risk/reward ratio is more extreme: they offer the potential for greater returns, but also far larger losses during downturns.
- As a satellite allocation, they can add significant upside, especially if you catch a positive cycle.
- If you use DCA and stay patient, you can turn volatility to your advantage.
Which indices cover each market and which ETFs track them?
To invest in developed or emerging markets through ETFs, you need to understand which indices each ETF tracks.
Each index has a different methodology, geographic coverage and weighting, so the choice is not as simple as it looks.
Let us look at the main indices, their differences and which ETFs track them in the European market.
🔶 MSCI World: the developed-markets index
The MSCI World Index is the most widely used index for global exposure to developed markets.
It is the starting point for thousands of European investors who want a global ETF in a single product.
🔶 What does it cover?
The index includes ~1,300 stocks from 23 developed countries, representing roughly 85% of those markets’ capitalisation. It includes companies from:
- North America (US, Canada)
- Europe (UK, France, Germany, Switzerland)
- Asia/Oceania (Japan, Australia, Hong Kong, Singapore)
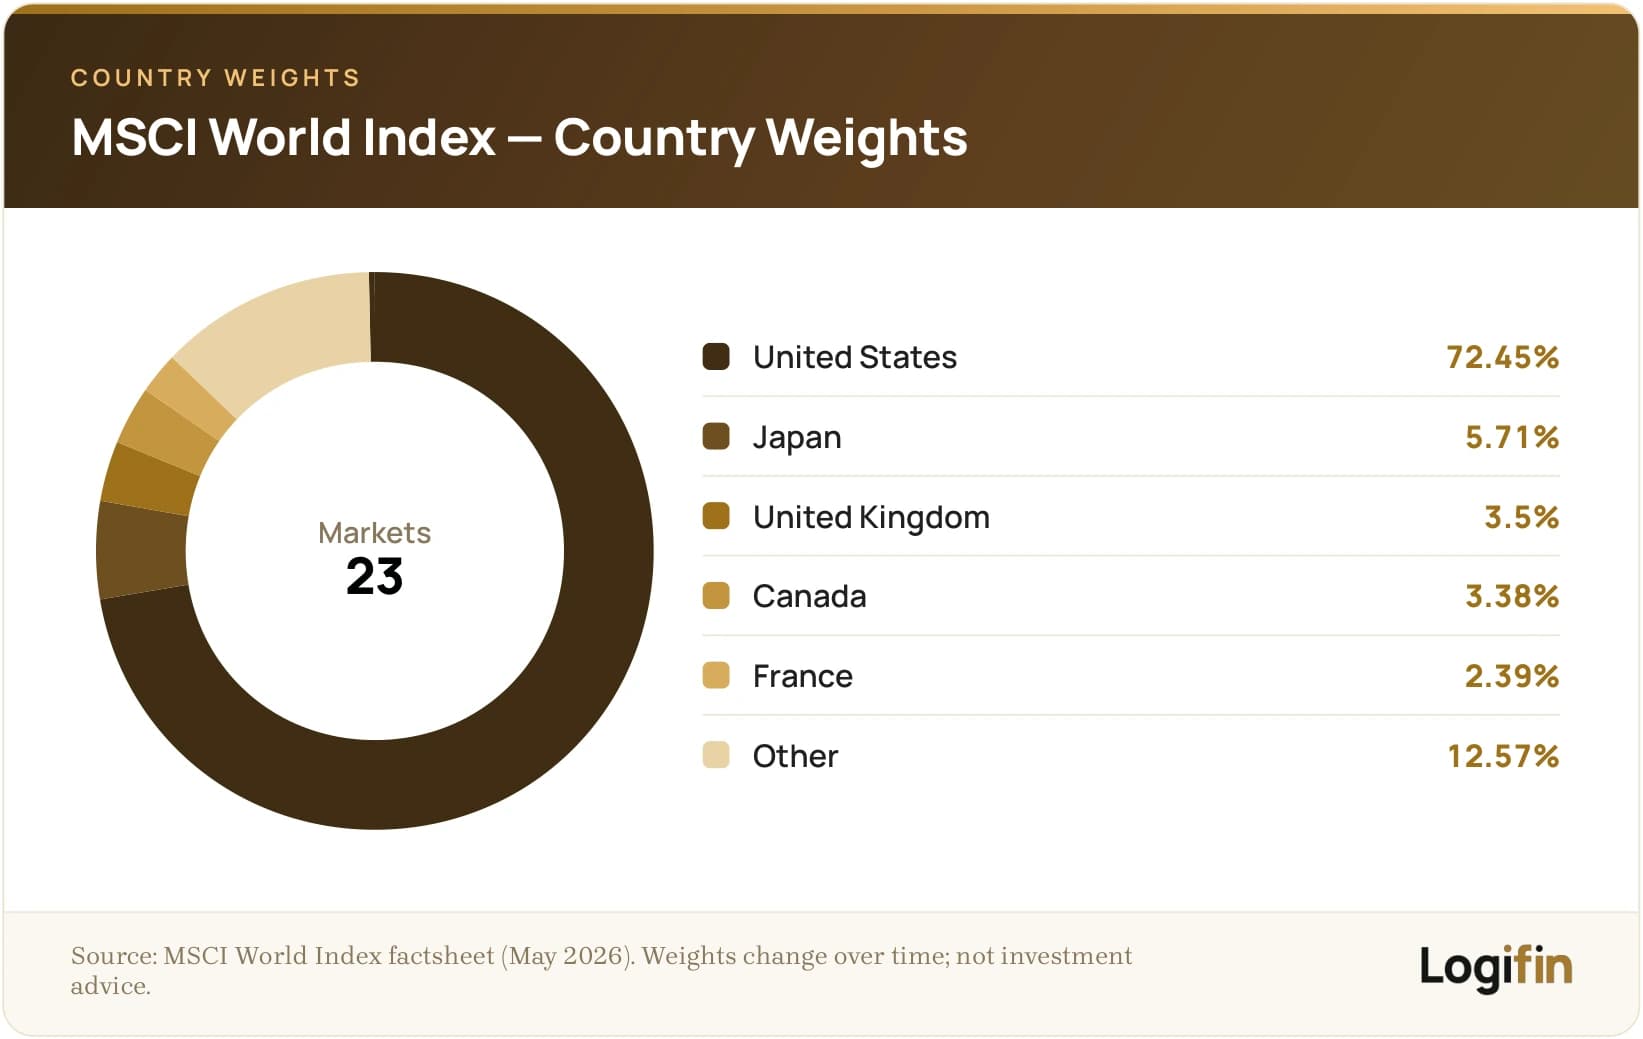
The index is market-cap weighted, which means the US market dominates (~70–72% of the index), while Europe and Japan play a smaller role.
🔶 What does it offer an investor?
The MSCI World is not just another global index.
It is a complete tool that helps an investor build a stable, balanced portfolio with a single choice.
International diversification through one ETF
- With a single product you gain exposure to hundreds of companies from developed markets across Europe, Asia and North America.
- This immediately reduces concentration risk and protects you from isolated economic crises.
Developed markets with stability and transparency
- The index includes economies with mature regulatory structures, high transparency and a stable financial environment.
- For the investor this translates into lower risk and a more predictable portfolio trajectory.
Avoiding country-specific risks
- By investing exclusively in one country, such as only the US or only Europe, you are exposed to economic, political and currency risks.
- The MSCI World reduces this dependency by spreading exposure across many mature markets.
The ideal foundation for Global Core-type portfolios
- The MSCI World is often the "central piece" of a passive portfolio.
- When combined with emerging markets, it offers almost full global coverage, building a balanced base on which you can add regional or thematic ETFs depending on your strategy.
🔶 Which ETFs track it?
There are dozens of ETFs tracking the MSCI World in Europe. Some of the best-known and most reliable are:
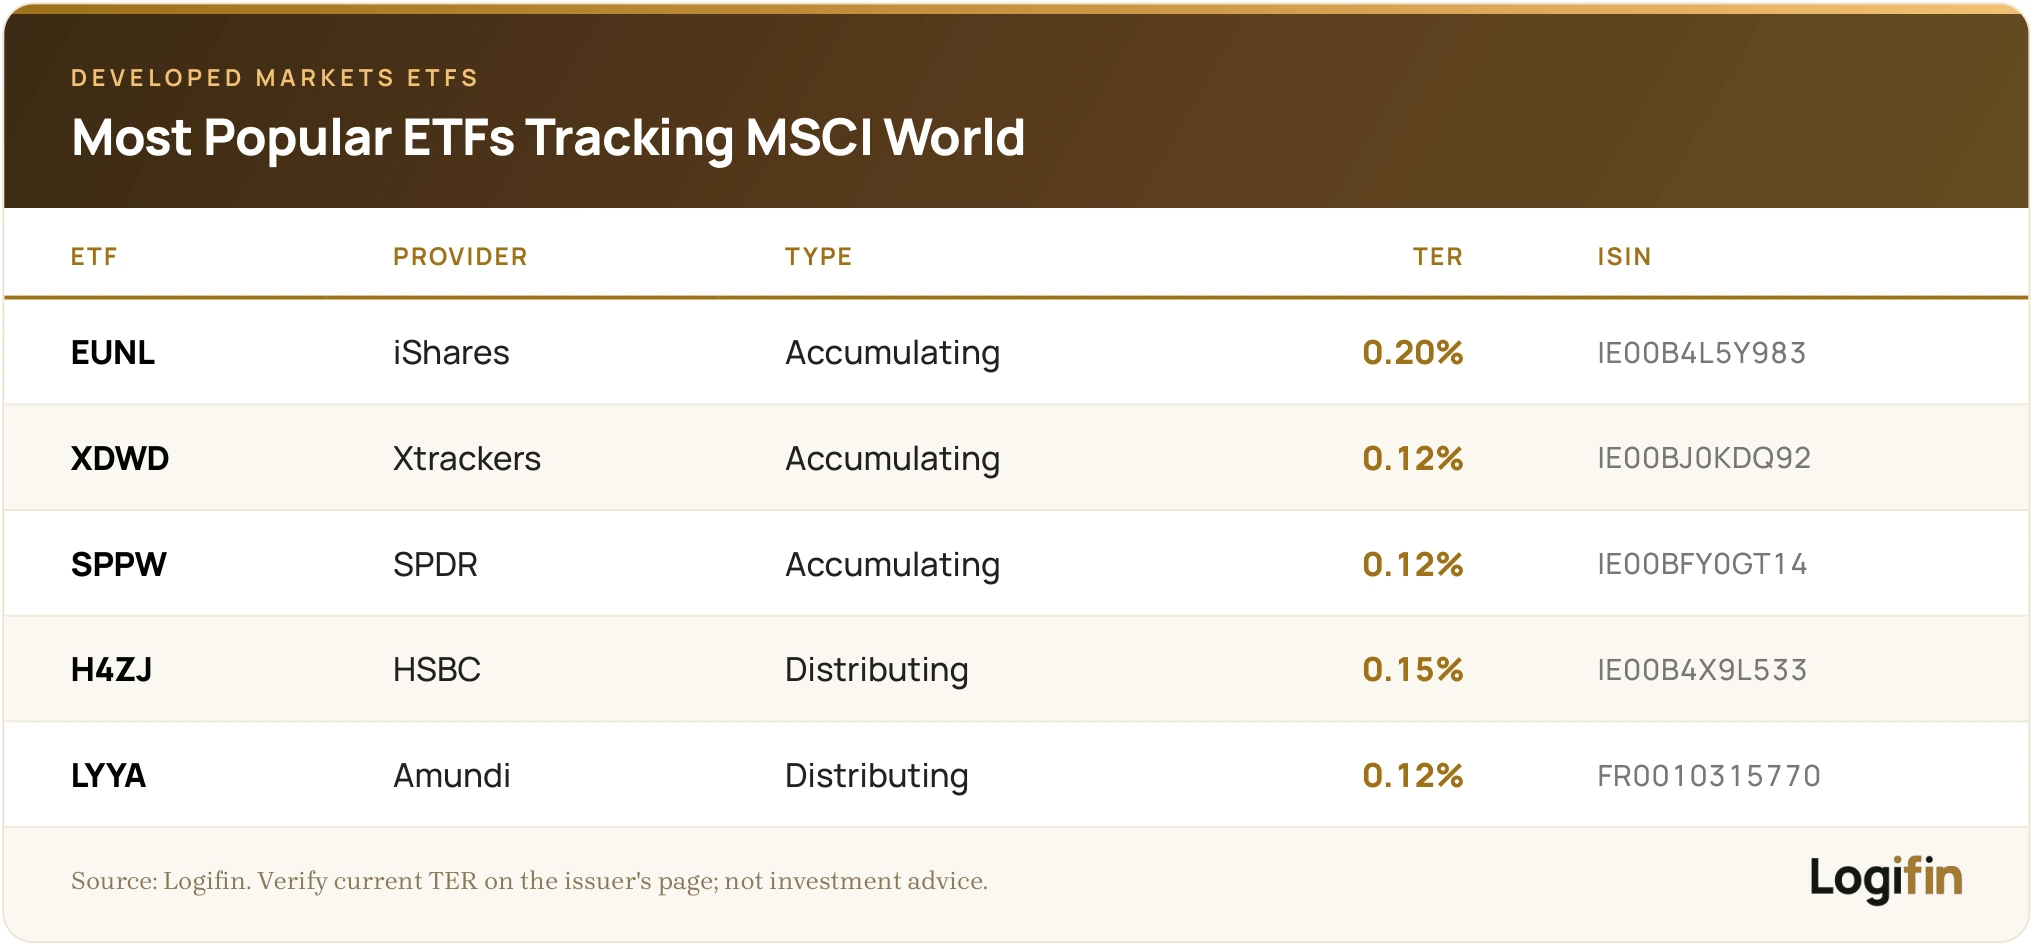
They are all UCITS-compliant, trade in EUR and are available on European platforms.
🔶 Mind the name: "World" ≠ "Global"
Despite its name, the MSCI World does not include emerging markets and there is no participation from China, India, Brazil, Indonesia, etc.
If you want full global exposure, you need to combine:
- MSCI World + MSCI Emerging Markets, or
- Choose an ETF on the MSCI ACWI (All Country World Index)
🔶 MSCI Emerging Markets: the emerging-markets index
It is one of the most widely recognised emerging-economy indices and, for many investors, a necessary complement for full global diversification.
🔶 What does it include?
The index covers ~1,200 stocks across 24 countries classified as "emerging". Some of the best-known markets in the index are:
- China
- India
- Brazil
- Mexico
- South Africa
- Taiwan
- Indonesia
- Thailand
- Turkey

Although the list varies, the largest weightings almost always belong to Asia, with China and India standing out, at least in terms of weight and growth prospects.
🔶 Why invest in emerging markets?
Emerging markets:
- Have higher growth rates than developed countries (GDP growth, population increase, urbanisation).
- Present greater opportunities in consumption, technology penetration and infrastructure.
- Offer long-term outperformance potential (but also greater volatility).
However, they also come with higher risks:
- Political instability
- Currency risks
- Lower transparency / liquidity
- Capital-control risks
🔶 Which ETFs track the MSCI Emerging Markets?
There are dozens of ETFs tracking emerging markets. Some of the best-known and most reliable are:

Most of these ETFs are accumulating and Irish-domiciled, which makes them suitable for European investors with a DCA strategy.
🔶 MSCI ACWI: the full "global" index
The MSCI ACWI (All Country World Index) is the most comprehensive global index an investor can use.
It represents almost the entire investable capitalisation of the planet and combines developed and emerging markets in a single, well-structured framework.
🔶 What does it include?
The index includes approximately:
- ~64% US. The strongest and most mature market in the world, heavily weighted towards technology and blue-chip companies.
- ~20% Europe + Japan. A market with solid fundamentals, high transparency and a strong industrial base.
- ~10–15% emerging markets, depending on the period. A small but meaningful allocation to emerging economies that add growth potential.
🔶 What does it offer an investor?
- You do not need to "set up" a manual World + EM combination.
- The index incorporates everything, keeps the right ratio and frees you from the need to rebalance.
- It is the cleanest choice for an investor who really wants a one-stop global solution.
🔶 Which ETFs track the MSCI ACWI?
There are many ETF options tracking the MSCI ACWI. Some of the best-known and most reliable are:

🔶 Alternative indices (FTSE, S&P, etc.)
Beyond the MSCI series, there are other large providers offering similar global or regional indices.
The ETFs tracking them often serve as alternatives with a slightly different methodology but similar investment logic.
Popular alternatives include:
- FTSE Developed / FTSE Emerging
FTSE uses somewhat different country-classification criteria, with some differences from MSCI, but the big picture stays similar.
- S&P Developed ex-US / S&P Emerging BMI
S&P’s indices have their own approach to selecting and weighting securities.
The corresponding ETFs are a good alternative for investors who prefer S&P’s philosophy and transparency.
👉 Methodology differences exist, but for the average retail investor the practical experience is very similar, as long as you check:
- the index composition
- the countries included
- the rebalancing frequency
- the major weightings by sector and region
In the end, what matters is understanding what the index represents and whether it fits your strategy.
Which geographical allocation strategy suits your profile?
Having seen what developed and emerging mean, how they perform historically and which ETFs track them, it is time for the most crucial question:
What is the right geographic allocation for your own portfolio?
There is no single right way, but there are well-documented strategies you can adapt to your needs, time horizon and risk tolerance.
🔶 Strategy 1: 100% Developed (MSCI World or S&P 500)
What it is:
- A strategy where the entire portfolio is invested exclusively in developed markets.
- It uses indices with proven historical stability and broad diversification.
- It usually relies on the MSCI World or only the S&P 500 as the single core ETF.
- Both indices cover high-quality, large-cap companies from mature economies.
Who it suits:
- new investors who want to start with an absolutely simple solution
- those with a lower tolerance for emerging-market risk
- investors who prefer ETFs with high liquidity, transparency and stable historical behaviour
Advantages:
- Simplicity, stability and a strong performance track record.
- This strategy is easy to manage and fits long-term DCA extremely well.
Disadvantages:
- It offers no exposure to faster-growing economies.
- For investors who want growth dynamics beyond developed markets it can feel restrictive.
🔶 Strategy 2: MSCI ACWI 100% (1 ETF, global exposure)
What it is:
- A strategy based on a single ETF that automatically combines developed and emerging markets.
- The MSCI ACWI brings the global investable market into one product, without the need for two separate ETFs.
- Its allocation is roughly 88% developed and 12% emerging markets, with small variations depending on the period and MSCI’s reviews.
Who it suits:
- those who truly want "the whole world" in one ETF without extra worries
- investors with limited time or who do not want to rebalance
- those who value the simplicity and clean structure of a single product
Advantages:
- You cover 47 countries and almost the entire international market with a single ETF.
- You do not need to track ratios, no rebalancing is required and the user experience is extremely simple.
Disadvantages:
- You cannot adjust your exposure to emerging markets.
- The EM allocation stays relatively small and does not increase, even if you want more growth or a more aggressive profile.
🔶 Strategy 3: 80% Developed / 20% Emerging
What it is:
- A more "hands-on" approach based on separate ETFs for developed and emerging markets.
- It is usually implemented by combining IWDA (MSCI World) and EIMI (MSCI Emerging Markets).
- The investor sets the ratio themselves, creating a global portfolio with increased EM exposure.
Who it suits:
- those who want more control over their exposure and do not want to be limited to the ACWI’s ~12% EM
- investors who believe in the long-term potential of emerging economies
- those who apply DCA and tolerate the increased fluctuations that come with EM
Advantages:
- It offers flexibility and the potential for higher upside, especially if emerging markets enter a period of outperformance.
- The investor can adjust the ratio according to their goal and increase the portfolio’s growth bias.
Disadvantages:
- It requires consistency in rebalancing, which is not always easy in periods of high volatility.
- It takes persistence, especially when emerging markets go through prolonged bearish phases.
🔶 Strategy 4: Core Developed + Satellite Thematic / EM
A flexible, more "alive" strategy built on a strong core of developed markets and complemented by targeted positions in emerging or thematic investments.
It usually includes:
- 70–80% in core developed ETFs such as MSCI World or S&P 500
- 10–20% in EM or thematic ETFs such as AI, Clean Energy, India, Cybersecurity, etc.
This way the portfolio stays stable at its base while gaining growth momentum in sectors or regions you consider promising.
Who it suits:
- those who want the stability of a core ETF plus the option for targeted growth
- investors who follow the markets and want a more flexible structure
- those who combine DCA in the core with more strategic rotation in the satellite part
Advantages:
- It offers dynamism, higher adaptability and the ability to lean into specific market trends.
- It also lets you express your personal convictions without disrupting the core portfolio.
Disadvantages:
- Management becomes more complex and requires attention to overlap between ETFs and to excessive risk concentration.
- It takes greater discipline so the satellite part does not turn into an uncontrolled pile of thematic picks.
Developed or emerging? What should you finally choose and why?
The comparison between developed and emerging markets has no single "winner".
For some, the stability of the US and Europe is the goal. For others, the future lies in growing economies with demographic momentum and huge needs for technology and infrastructure.
The guide below works as a quick compass to spot which index fits your own profile.
🔶 Want simplicity and stability?
- Include the MSCI World or the S&P 500 in your investments. The cleanest, most predictable approach.
- You invest in some of the largest and most resilient economies in the world, with low cost, high liquidity and a proven solid performance record.
- An ideal solution for a core portfolio.
🔶 Want full coverage without many decisions?
- Include the MSCI ACWI in your investments.
- With a single position you gain global exposure to developed + emerging markets without needing to rebalance or track trends.
- It is the most comfortable choice for those who want "the whole world" in one ETF.
🔶 Want to boost the chance of outperformance?
- Include emerging markets in your investments as a satellite option (10–20%).
- You do not need to over-expose yourself to benefit from a new growth cycle in countries such as India, Indonesia or Vietnam.
- A small but strategic allocation can significantly boost your portfolio’s growth potential.
🔶 Have a DCA strategy and a long horizon?
- Adding emerging markets makes sense.
- During downturns, volatility turns into opportunity, because you buy more units at low valuations.
- If emerging markets enter a new upward cycle, steady monthly contributions can create outsized returns.
🔶 Think geographically, not "in two camps"
You do not have to "pick a camp". Often, balance is the best decision:
- 80/20 (Developed/EM) → A good risk/reward balance
- 90/10 with DCA into Emerging Markets → More aggressive but controlled
- 70/20/10 (Developed/EM/Thematic) → More complex, but a dynamic portfolio
Geographic allocation is one of the few things you can fully control on your investing journey.
Choose the mix that makes you feel confident, informed and consistent, then stay true to your plan.
Conclusion and practical takeaways
The "Developed or Emerging" dilemma has no single right answer for everyone. It does have a right approach: understand what each category offers and what it costs, then decide based on your own profile rather than the last five years’ returns.
🔑 Key takeaways:
- Developed markets offer stability and mature economies; emerging markets offer higher growth prospects with greater volatility and risk.
- Cycles rotate: emerging markets outperformed in 2003–2007 and 2009–2010, but lagged in 2011–2020. No one can reliably predict the next cycle.
- You do not have to pick "one or the other": an MSCI ACWI ETF gives you both in a single product, with emerging markets at ~10–15%.
- The share of emerging markets in your portfolio is a risk-profile decision, not a bet on which market will "run" next.
Practical Tips:
1️⃣ Start from your profile, not the charts: If big swings make you anxious, a portfolio with a small or zero emerging-markets allocation is a perfectly valid choice.
2️⃣ If you want simplicity, one product is enough: Many investors choose a global index such as MSCI ACWI and let the developed/emerging split adjust automatically.
3️⃣ If you want control, set an explicit weight: A combination like 80% developed / 20% emerging (e.g. IWDA + EIMI) lets you decide the balance yourself, as long as you keep it consistent.
4️⃣ Do not chase the cycle: Adding emerging markets after they have already rallied is one of the most common mistakes. If you believe in the position, build it gradually and consistently.

The content of this article is provided exclusively for informational and educational purposes and does not constitute investment advice or a recommendation to buy or sell financial products. The information is based on publicly available sources considered reliable, without any guarantee of accuracy or completeness. Before making any financial or investment decision, it is recommended that you consult a certified professional advisor or accountant, taking into account your own financial situation and risk profile. The Logifin team bears no responsibility for any direct or indirect damages arising from the application of the information presented.
Related articles

What is the right geographical allocation for a European investor?
Europe, USA or global? How to build a balanced portfolio based on geography
18 min read

The 5 most popular stock market indices – and the ETFs that track them
From the S&P 500 to the MSCI World: Which indices define global markets
22 min read

What are thematic ETFs and are they worth having in your portfolio?
From AI and clean energy to biotechnology: investing in trends or a hype trap?
16 min read

What is a recession and how it affects investors?
How a recession is defined, what causes one, how the markets usually behave during it and what an investor can do to prepare in advance.
24 min read
EXPLORE LOGIFIN
Everything you need in order to learn, plan and track your investments.
Logifin Blog
Learn everything you need to get your finances in order and invest with confidence.
Logifin Insights
What moves the markets and what it means for a long term investor. Short and without the noise.
Logifin Tools
Free, inside the site, no signup. Everything you calculate stays on your device.
Logifin ETF Hub
Find the ETF that fits you: 550+ UCITS ETFs, smart filters and in-depth comparisons.
Logifin Guides
A series of guides that builds your investment plan step by step. The first guide is free for everyone.
Logifin Circle
The tools and the Hub are free for everyone. You become a member for the intelligence that never stops.