The 5 most popular stock market indices – and the ETFs that track them
From the S&P 500 to the MSCI World: Which indices define global markets
6 August 2025 · 22 min read

What is a stock market index and why does it matter?
Before we look at the world’s best-known indices, it is worth understanding what an index actually is and why it plays such a central role in the investment strategy of millions of people.
A stock market index is a “basket” of stocks designed to reflect the performance of a specific market or market segment.
For example:
- The S&P 500 tracks the 500 largest U.S. companies
- The MSCI World represents the most developed markets worldwide
- The Nasdaq 100 focuses on technology and innovation
Each index has its own selection and weighting methodology.
Some are based on company market capitalisation, others use thematic criteria (e.g. ESG, technology, emerging markets, etc.).
🔶 Why do they matter to the investor?
Stock market indices are not just numbers that appear on charts.
They are the foundation on which the entire philosophy of passive investing and, by extension, the world of ETFs rests.
They are used as benchmarks
- When you want to assess whether your portfolio is performing well, you usually compare it with an index.
- The index acts as a reference point that tells you whether your plan is on track or needs revisiting.
They form the basis of ETFs
- Most ETFs are passive.
- This means they do not pick individual stocks but precisely replicate an index.
- The index determines the ETF’s exposure, risk and return.
They offer transparency and stability
- Indices have a clear methodology and publicly available rules.
- You always know what you are investing in and how the included stocks are selected, which builds trust and reduces uncertainty.
💡 In the era of passive investing, indices are the real heart of the ETF world.
Without them, ETFs would not have the form we know today, nor the efficiency and transparency they offer investors.
S&P 500 – The “king” of indices
When we talk about passive investing, the S&P 500 is almost synonymous with the very notion of “the market”.
It is the most widely followed index in the world, with enormous influence over the global investment community. Millions of investors, institutional and retail, use the S&P 500 as a benchmark for their performance.
🔶 What does it include?
The index includes the 500 largest U.S. companies that meet specific criteria for liquidity, market capitalisation and earnings stability.
Although it is considered “representative” of the U.S. economy, in reality many of its companies are multinational giants operating on a global scale.
Sectors with the greatest weight:
- Technology (e.g. Apple, Microsoft, Nvidia)
- Energy (e.g. ExxonMobil, Chevron)
- Healthcare (e.g. Johnson & Johnson, UnitedHealth)
- Consumer goods (e.g. Procter & Gamble, Coca-Cola)
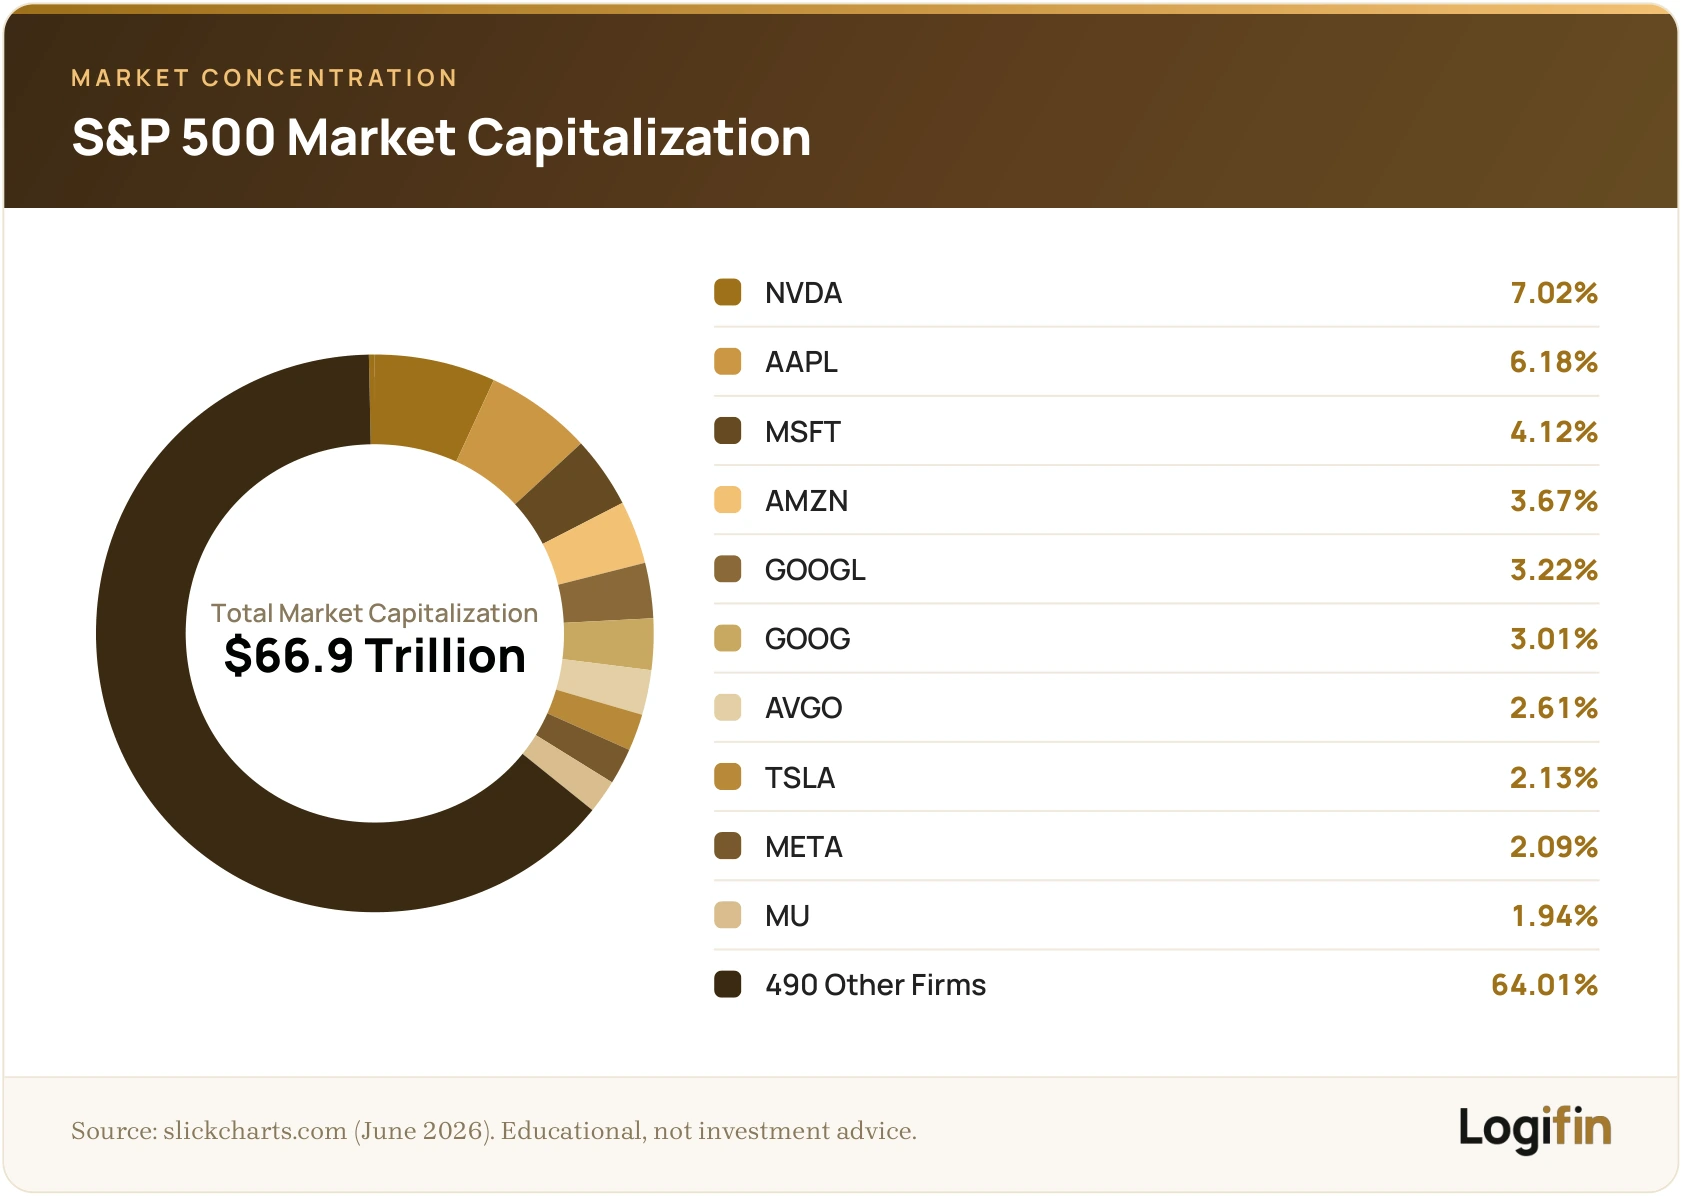
In total, the S&P 500 covers approximately 75–80% of the total capitalisation of U.S. equities.
🔶 What makes it so important?
- It is broadly diversified by market cap, but also geographically (through the international operations of its companies)
- It has a long historical data series (since 1957), which allows analysis over a long-term horizon
- It is used by most pension funds, asset managers and academic papers as a benchmark for the U.S. market
Even though it includes only U.S. companies, the S&P 500 is often treated as an indirect gauge of the global economy, because many of its companies derive a significant share of their revenue from markets outside the U.S.
🔶 Which ETFs track it?
There are dozens of ETFs tracking the S&P 500 in Europe. Some of the most well-known and reliable are:

All are UCITS-compliant, trade in EUR and are available on European platforms.
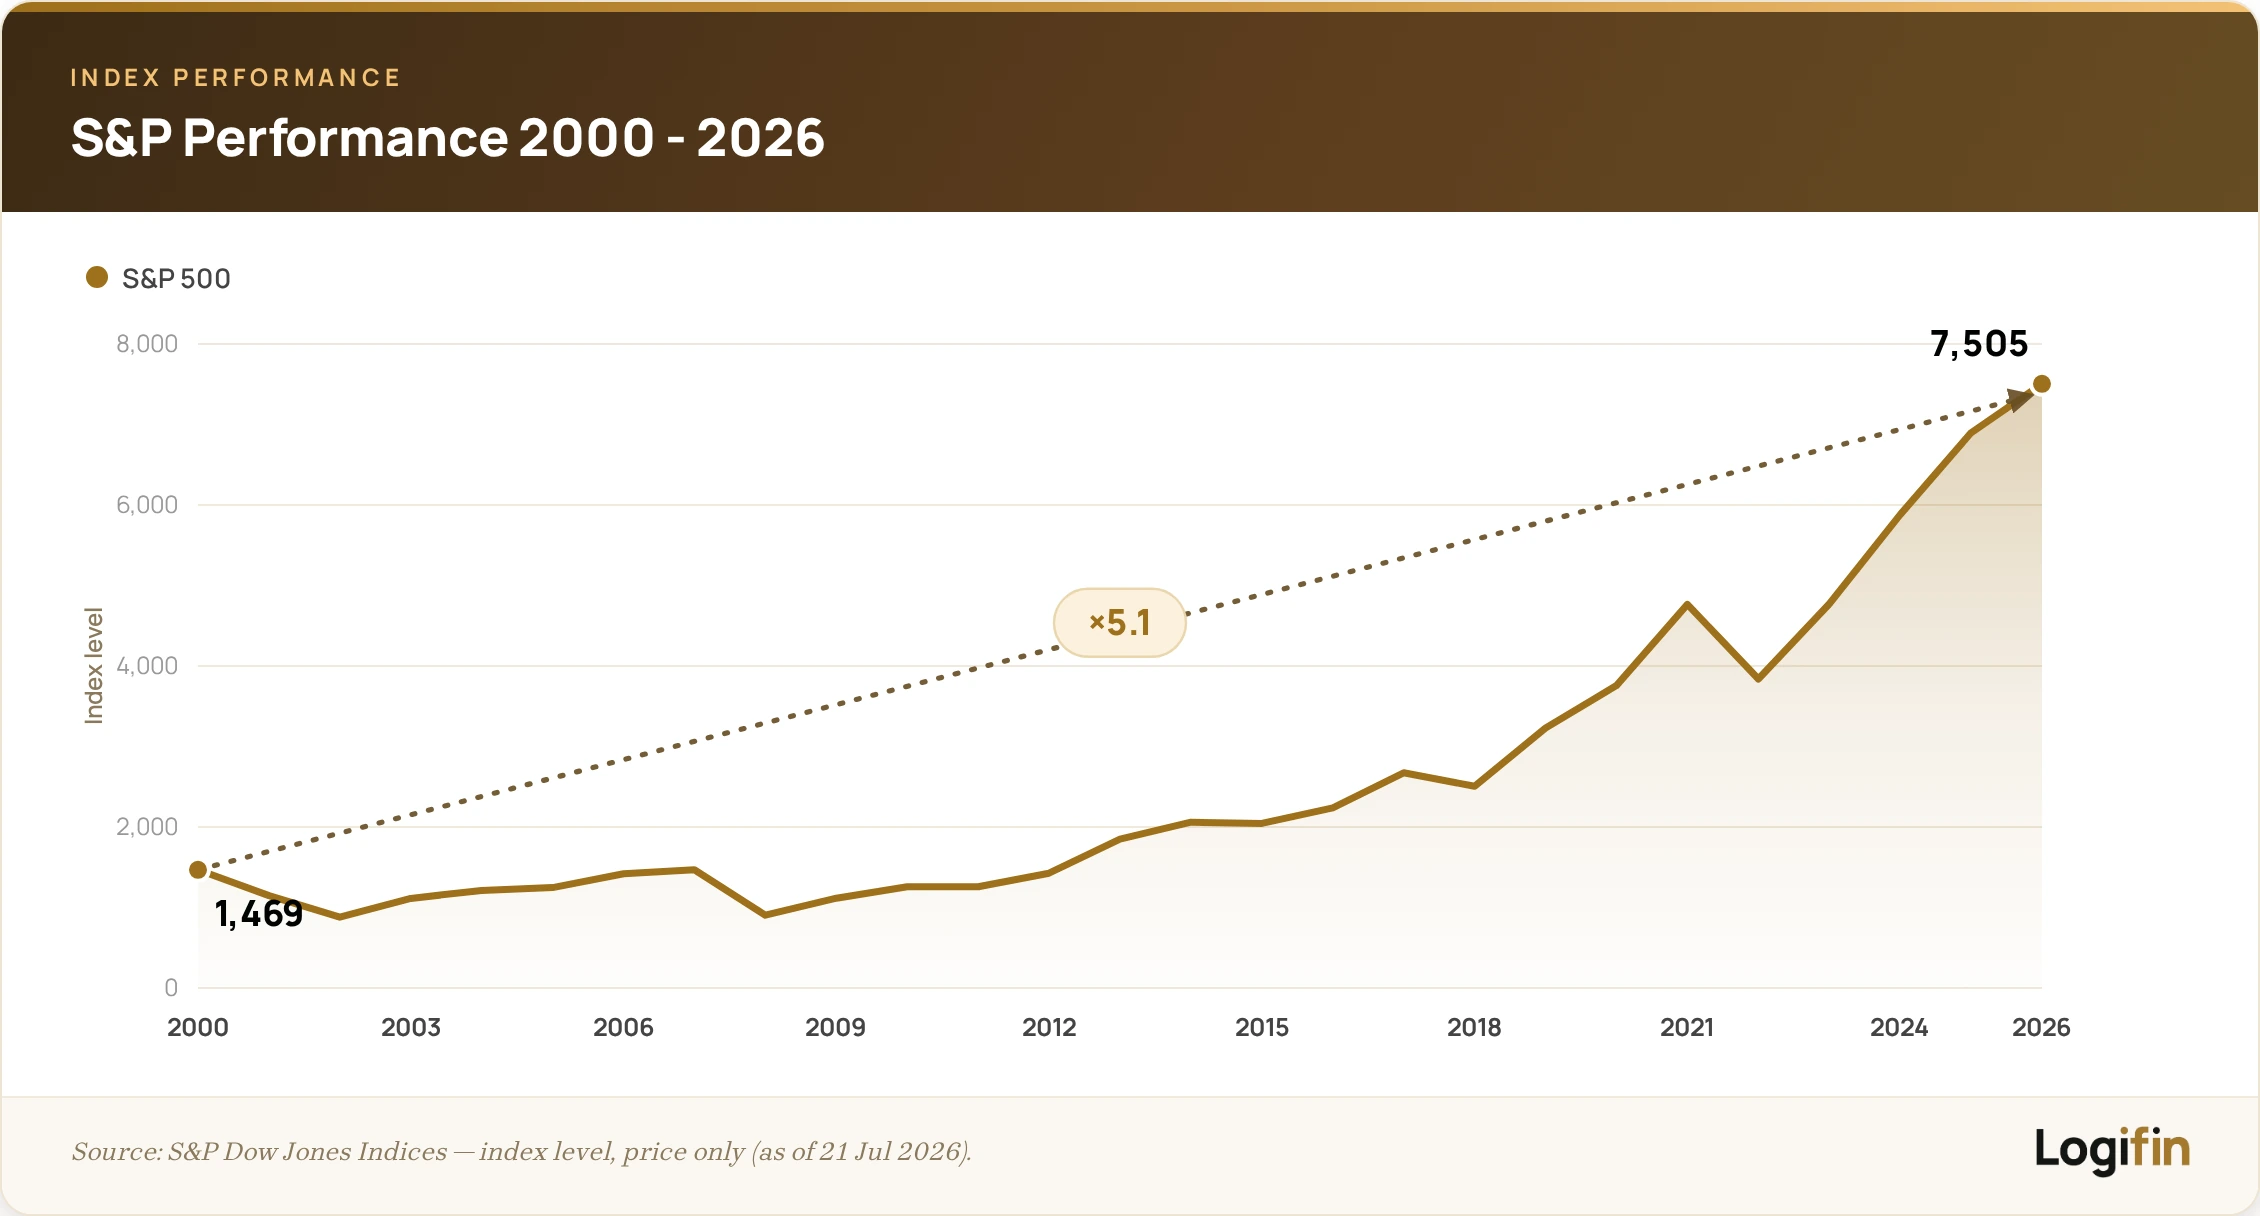
🔶 Long-term performance of the S&P 500: what the historical data show
- Historically, the S&P 500 has delivered strong long-term returns on a total-return basis.
- Although annual returns can fluctuate widely, the long-term data show that the index has moved within a range of roughly 7% to 10% per year in real/nominal terms when reinvested dividends are included.
- This track record makes the index an excellent choice as a portfolio core, even for investors outside the U.S.
MSCI World – The index that represents the developed world
The MSCI World Index is the most widely followed index for global exposure to developed markets.
It is the starting point for thousands of European investors who want a global ETF with a single product.
🔶 What does it cover?
The index includes ~1,300 stocks from 23 developed countries, representing approximately 85% of the capitalisation of those markets.
It includes companies from:
- North America (U.S., Canada)
- Europe (United Kingdom, France, Germany, Switzerland)
- Asia/Oceania (Japan, Australia, Hong Kong, Singapore)
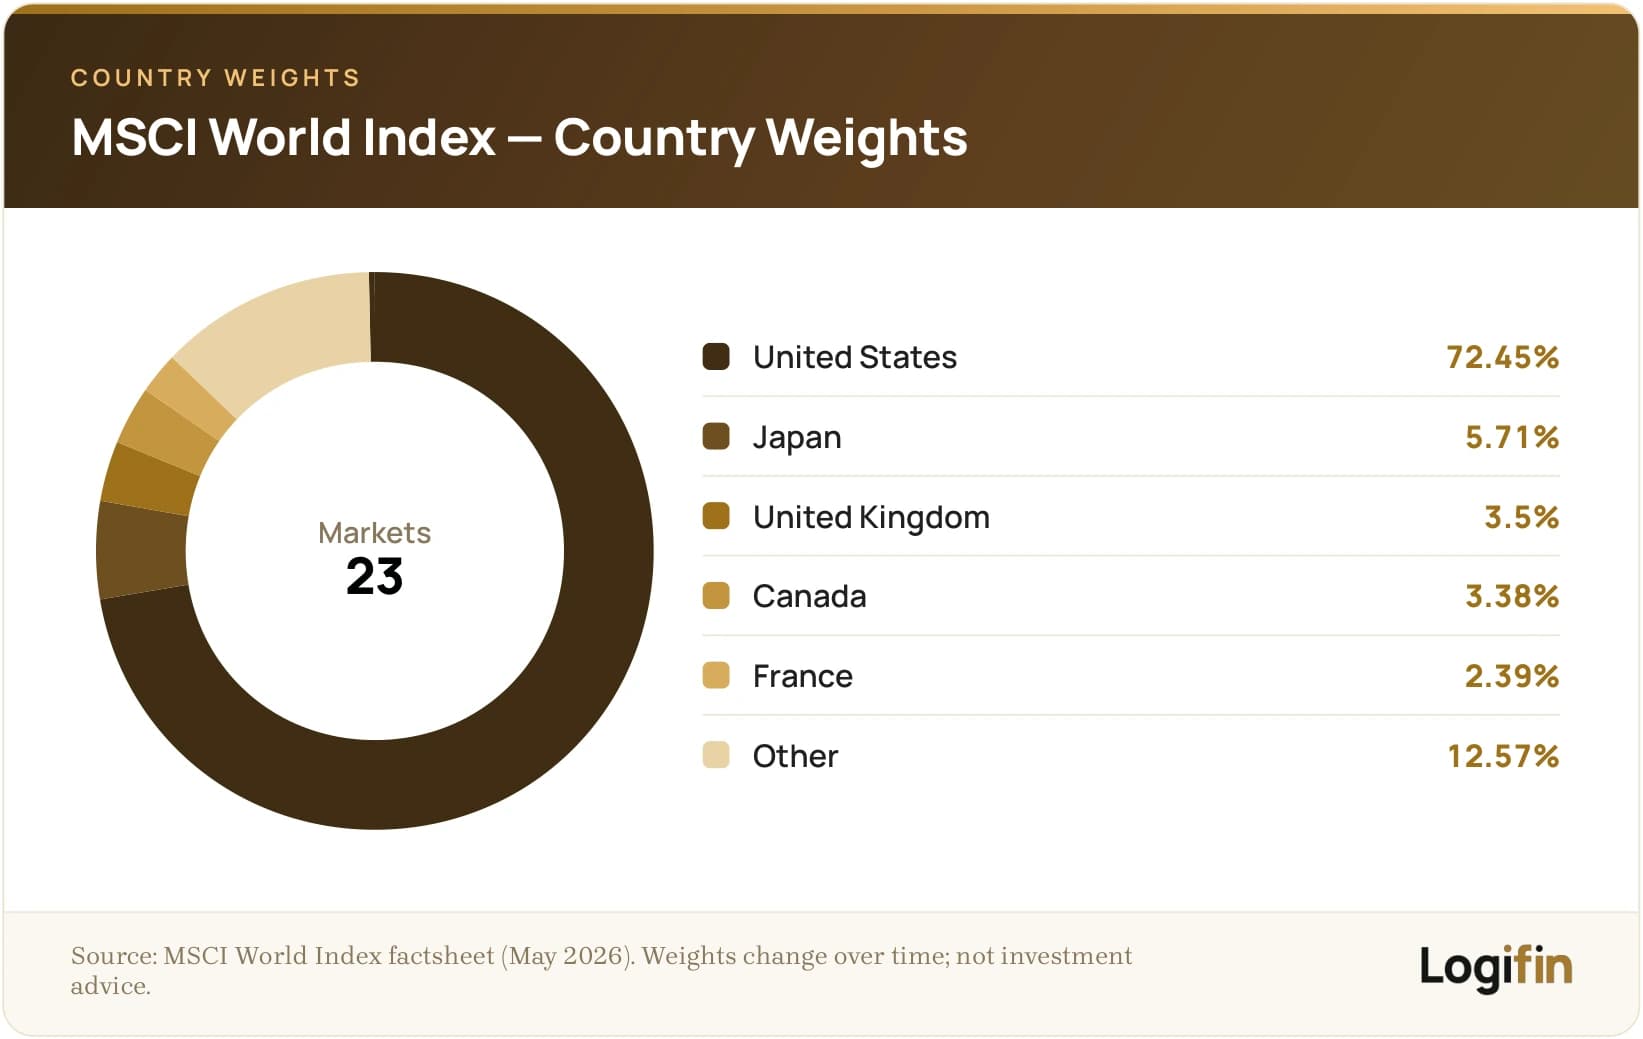
The index is market-cap weighted, which means the U.S. market dominates (~70–75% of the index), while Europe and Japan play a smaller role.
🔶 What does it offer an investor?
The MSCI World is not just another global index.
It is a complete tool that helps an investor build a stable, balanced portfolio with a single choice.
International diversification through a single ETF
- With a single product you gain exposure to hundreds of companies from developed markets across Europe, Asia and North America.
- This immediately reduces concentration risk and protects you from isolated economic crises.
Developed markets with stability and transparency
- The index includes economies with mature regulatory structures, high transparency and a stable financial environment.
- For the investor this translates into lower risk and a more predictable portfolio trajectory.
Avoiding country-specific risks
- By investing exclusively in one country, such as only the U.S. or only Europe, you are exposed to economic, political and currency risks.
- The MSCI World reduces this dependence by spreading exposure across many mature markets.
The ideal foundation for Global Core portfolios
- The MSCI World is often the “central piece” of a passive portfolio.
- When combined with Emerging Markets, it offers almost complete global coverage, building a balanced base on which you can add regional or thematic ETFs according to your strategy.
🔶 Which ETFs track it?
There are dozens of ETFs tracking the MSCI World in Europe. Some of the most well-known and reliable are:
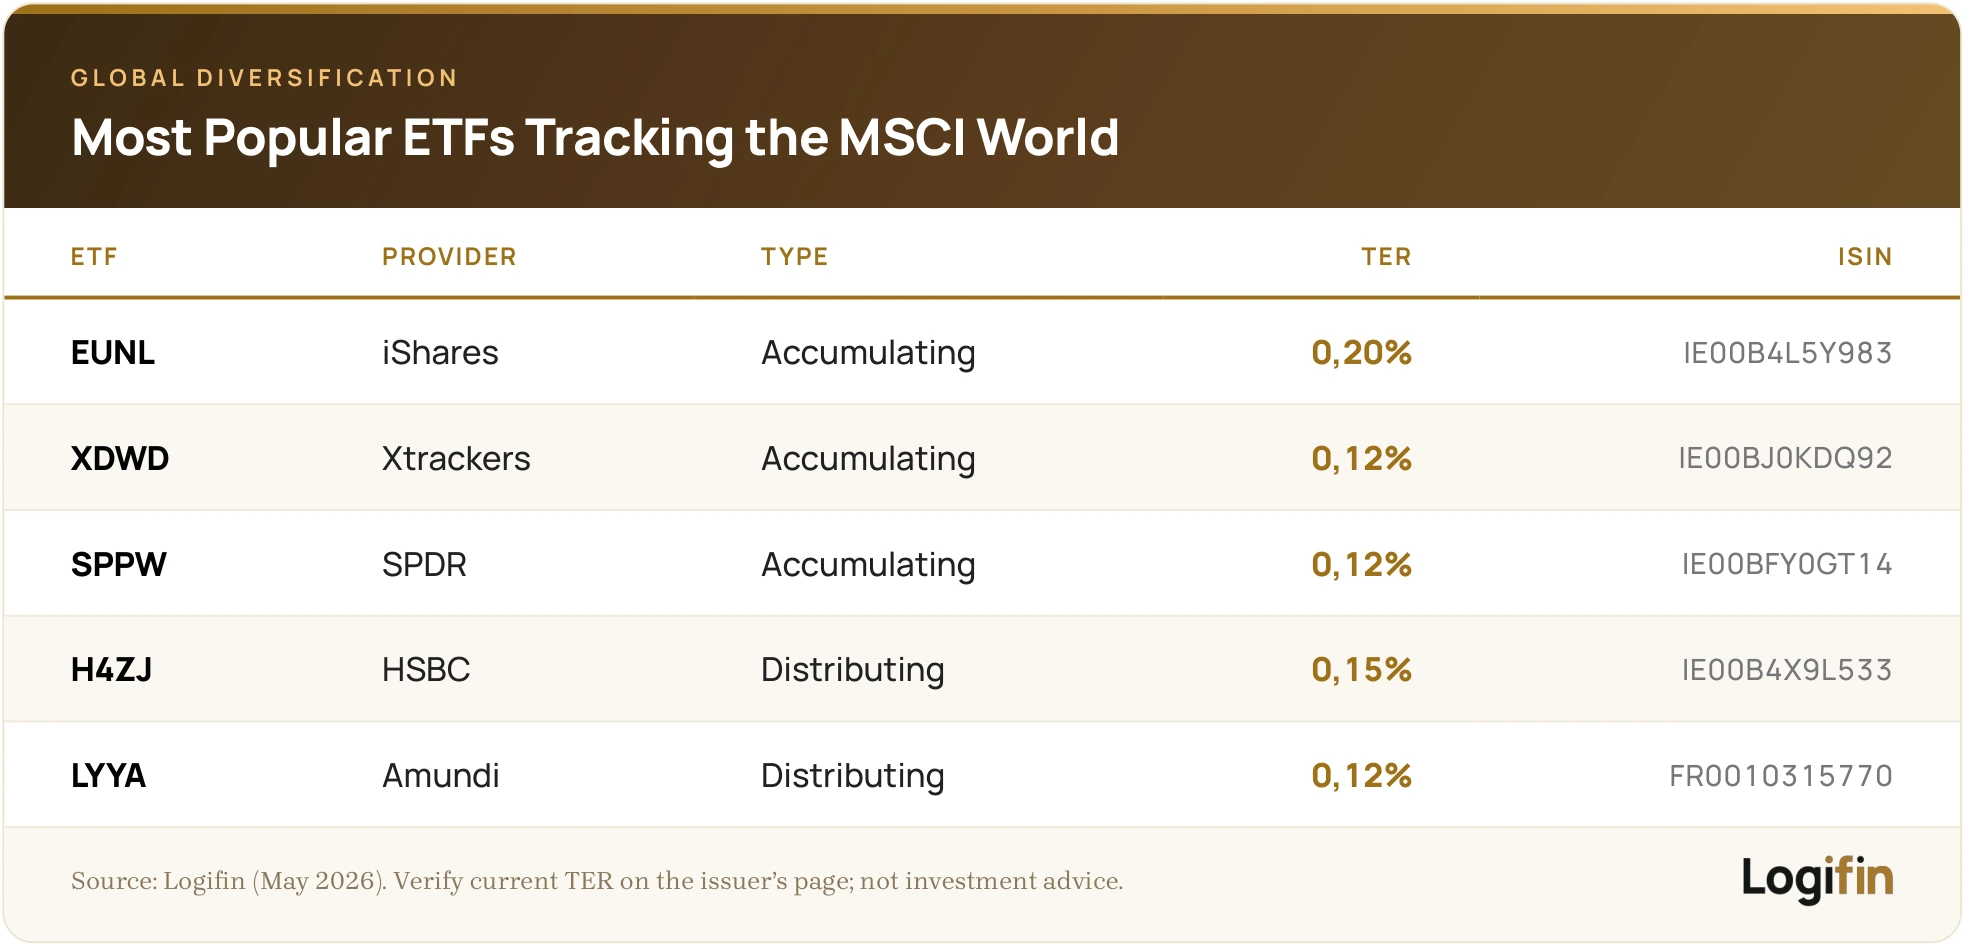
All are UCITS-compliant, trade in EUR and are available on European platforms.
🔶 Mind the name: “World” ≠ “Global”
Despite its name, the MSCI World does not include emerging markets. That is, there is no participation from China, India, Brazil, Indonesia, etc.
If you want full global exposure, you need to combine:
- MSCI World + MSCI Emerging Markets, or
- Choose an ETF on the MSCI ACWI (All Country World Index)
🔶 Long-term performance of the MSCI World: what the historical data show
The long-term performance of the MSCI World highlights three key points:
- Resilience to crises and quick recovery. Even after severe corrections, the index returns to new highs within the following years, showing the strength of developed markets.
- Gradual and predictable growth. The index’s path is less “explosive” than emerging markets but significantly more stable, making it ideal for core portfolios.
- High returns over time. The combination of stability, transparency and broad participation of leading companies leads to strong cumulative returns, especially when combined with DCA.
MSCI Emerging Markets – Exposure to emerging markets
If the MSCI World represents the “stability” of the developed world, the MSCI Emerging Markets is the window into the “dynamic but volatile” future of emerging markets.
It is one of the most widely recognised indices of emerging economies, while for many investors it is a necessary complement for full global diversification.
🔶 What does it include?
The index covers more than 1,200 stocks across 24 countries classified as “emerging”. Some of its best-known markets are:
- China
- India
- Brazil
- Mexico
- South Africa
- Taiwan
- Indonesia
- Thailand
- Turkey

Although the list varies, the largest weights almost always belong to Asia, with China and India standing out, at least in terms of participation and growth prospects.
🔶 Why invest in emerging markets?
Emerging markets:
- Have higher growth rates than developed countries (GDP growth, population growth, urbanisation)
- Present greater opportunities in consumption, tech penetration and infrastructure
- Offer long-term potential to outperform (but also higher volatility)
However, they also come with higher risks:
- Political instability
- Currency risks
- Lower transparency / liquidity
- Capital-control risks
🔶 Which ETFs track the MSCI Emerging Markets?
There are dozens of ETFs tracking emerging markets. Some of the most well-known and reliable are:

Most ETFs are accumulating and Irish-domiciled, which makes them suitable for European investors using a DCA strategy.
🔶 Long-term performance of the MSCI Emerging Markets: what the historical data show
Emerging markets are often more volatile than developed ones, but they offer higher growth potential.
The long-term performance of the MSCI Emerging Markets highlights three key points:
- Higher volatility but also greater potential upside. Emerging markets react more sharply to global economic developments, but when conditions are favourable they can outperform significantly.
- Strong recovery after difficult years. Despite sharp declines, the index shows an ability to gradually return to an upward path, especially after periods of recession or currency pressure.
- An ideal complement for global portfolios. Emerging markets provide exposure to countries with a young population, rising income and rapid technology adoption.
In a small but targeted allocation, they act as a growth lever alongside the stable core of developed markets.

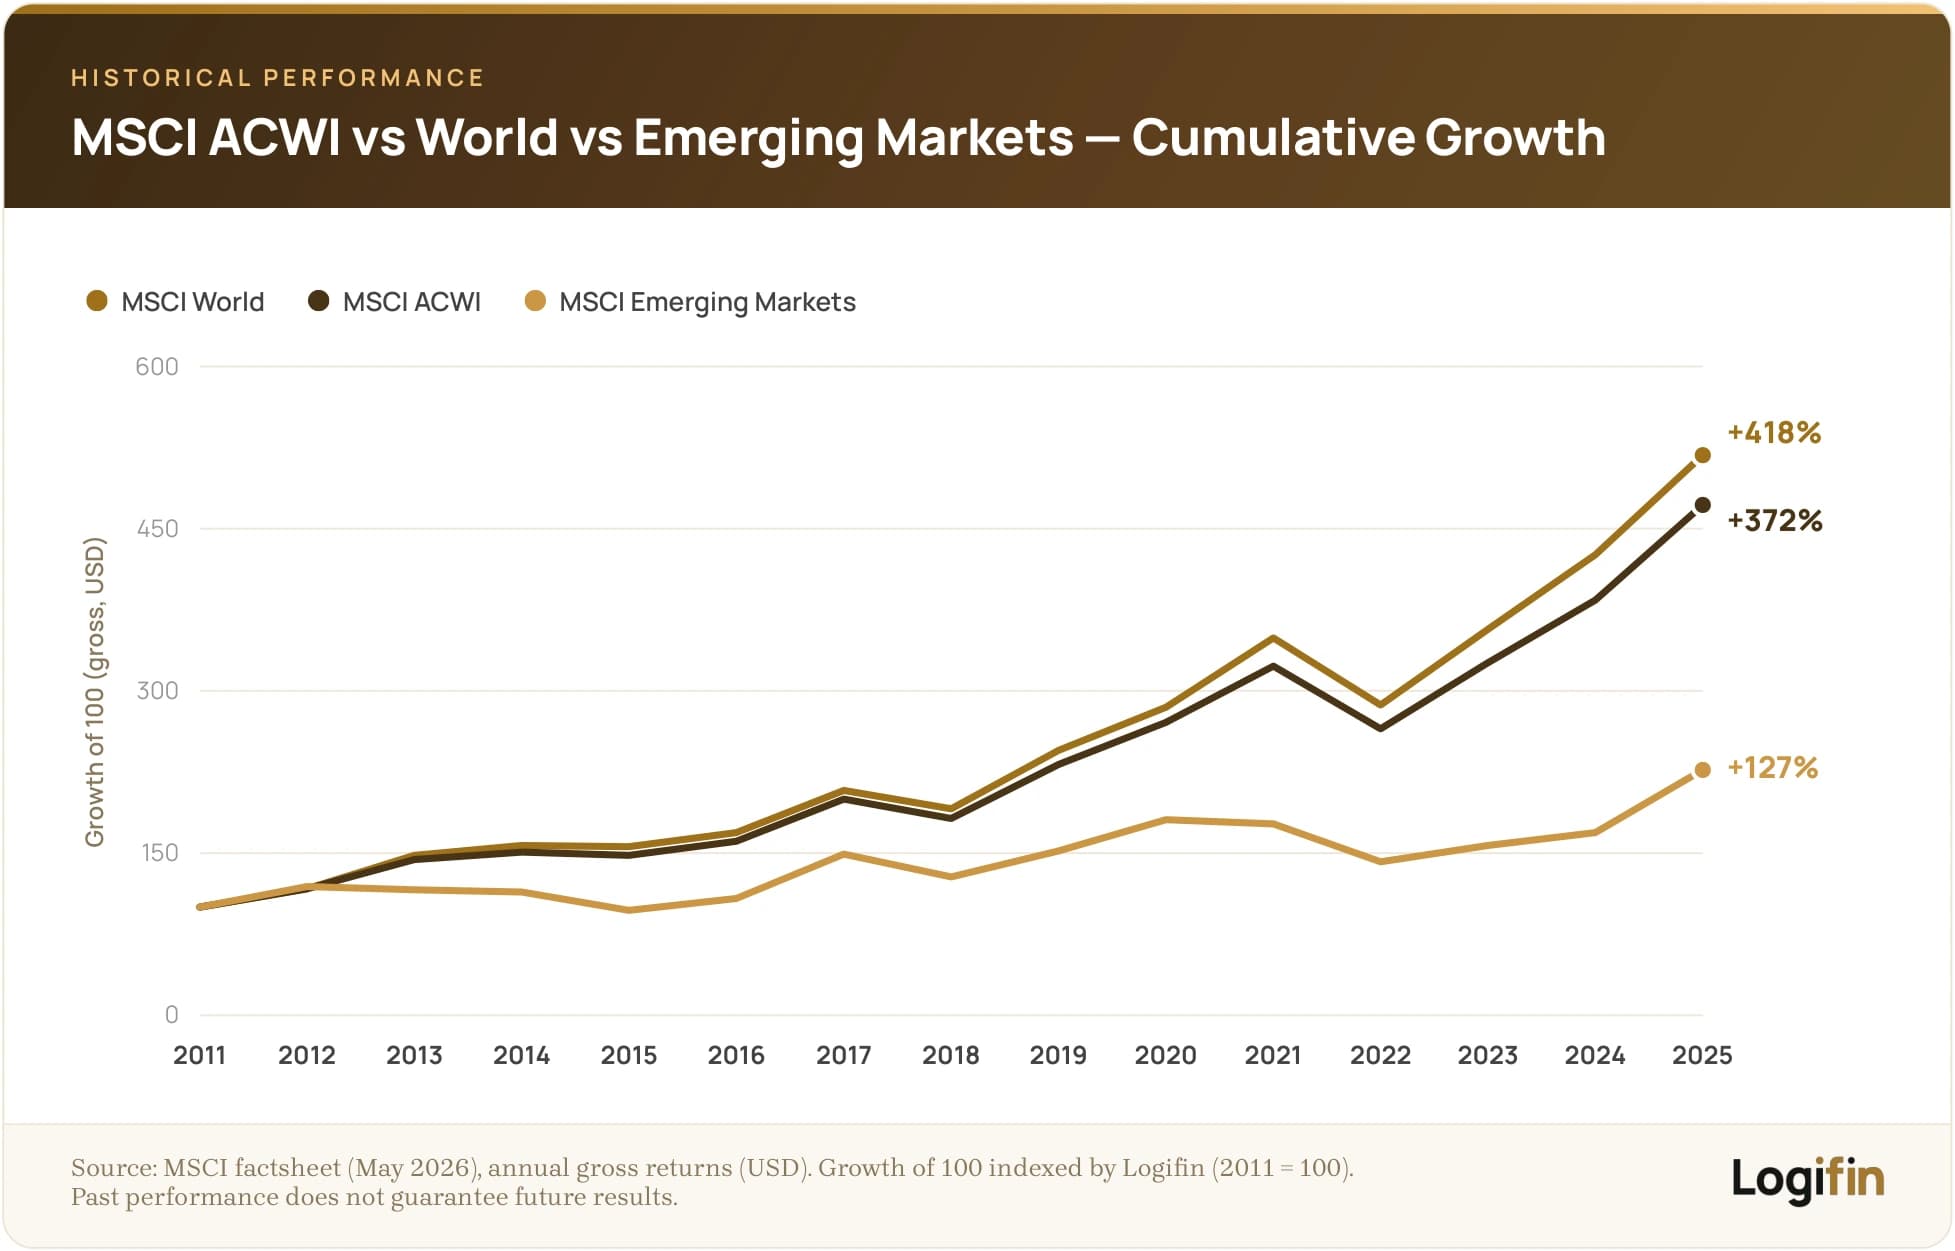
The MSCI Emerging Markets had sharper swings than the MSCI World over 2015–2025, yet showed remarkable resilience.
Despite the corrections of 2018, 2021 and 2022, the index posted a 10-year return of 8.03%, confirming that emerging markets retain strong long-term momentum when the investor is patient and consistent.
Nasdaq 100 – The innovation index
If the S&P 500 is the “mirror” of the U.S. economy, the Nasdaq 100 is the showcase of the technological revolution.
It is an index of high growth, high volatility and impressive long-term performance, which particularly attracts those who invest with a growth profile and are not afraid of swings.
🔶 What does it include?
The Nasdaq 100 includes the 100 largest non-financial companies listed on the Nasdaq exchange (U.S.).
The index’s composition places enormous emphasis on the technology sector, but it also includes companies from:
- Communications (e.g. Meta, Alphabet)
- Consumer goods (e.g. Amazon, Tesla)
- Healthcare (e.g. Amgen, Moderna)
- Software, hardware and AI platforms
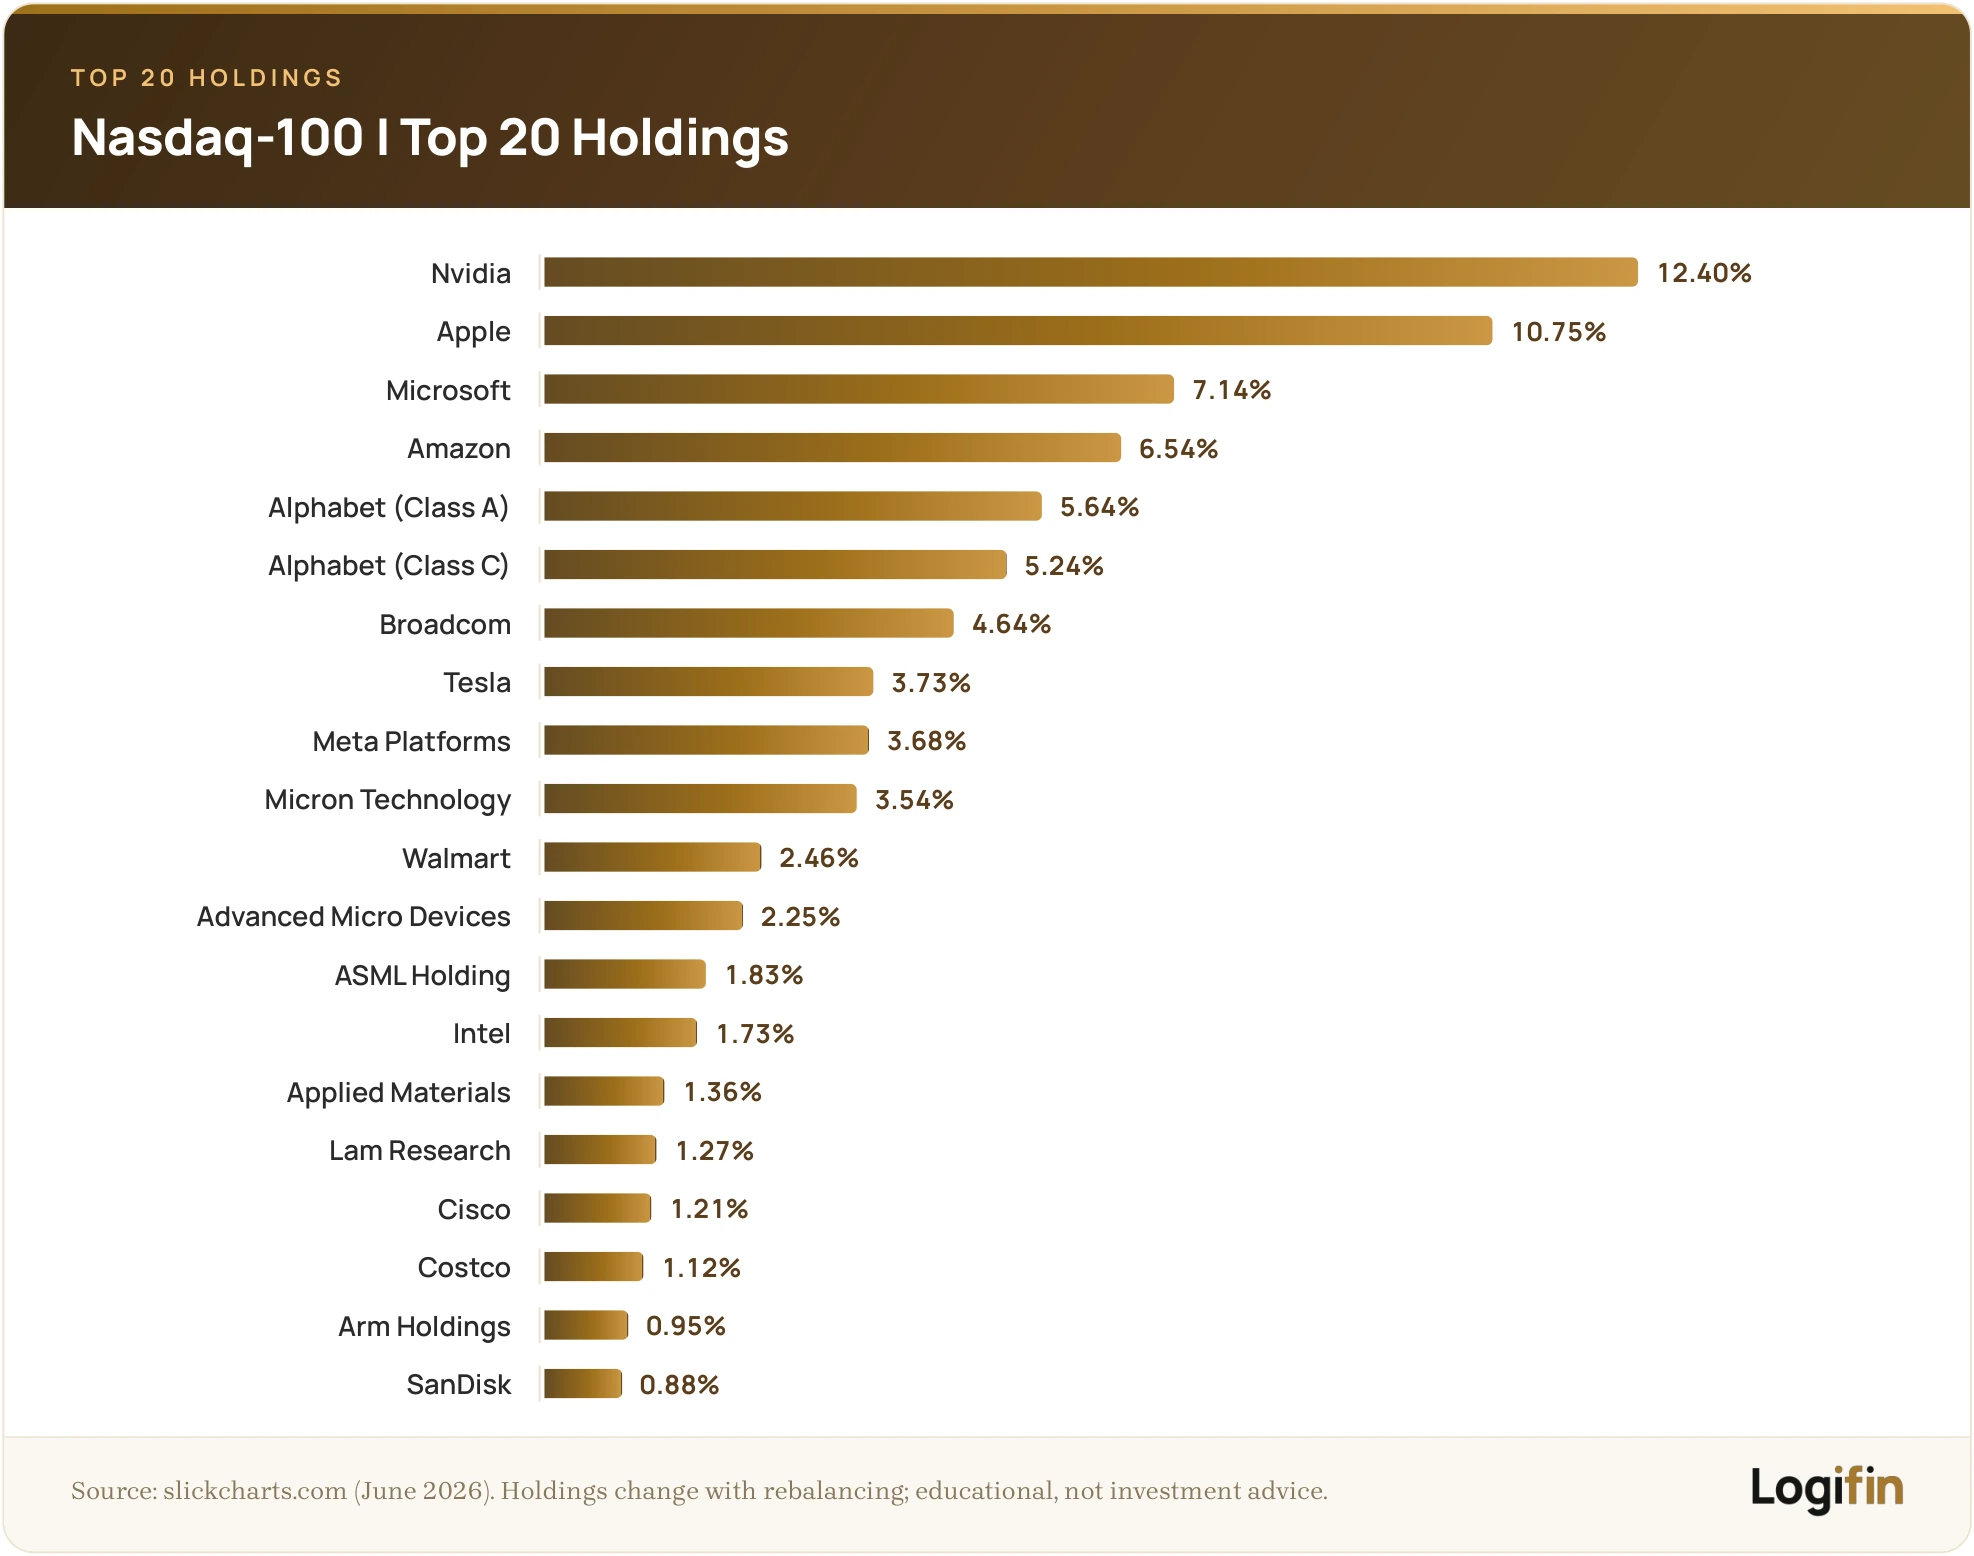
The index does not include banks, insurers or other financial companies, which sets it apart from the S&P 500.
🔶 What does it offer an investor?
The Nasdaq 100 offers exposure to some of the most innovative and fastest-growing companies in the world.
It is an index that reflects technological progress and the transformation of the global economy.
- Exposure to high-growth companies and innovation leaders. It includes businesses shaping the future of technology, from software and AI to cloud infrastructure and digital services. For an investor this means access to growth companies with global reach.
- Strong performance in bull markets. The index has outperformed the S&P 500 in many periods of strong growth, as growth companies tend to react faster in a positive economic environment.
- Increasing the growth bias of your portfolio. Adding the Nasdaq 100 strengthens the growth dimension of the portfolio, giving it more “momentum” and the potential for higher long-term returns.
🔶 Along with the opportunities come significant risks
- Increased volatility. The concentration in technology sectors means the index reacts strongly to interest-rate changes, economic turbulence or regulatory developments.
- Heavy dependence on a few mega-cap companies. The Magnificent 7 disproportionately influence the index’s path. If these companies slow down, the entire Nasdaq 100 feels it far more sharply.
🔶 Which ETFs track it?
Some of the most well-known and reliable ETFs tracking the Nasdaq 100 are:
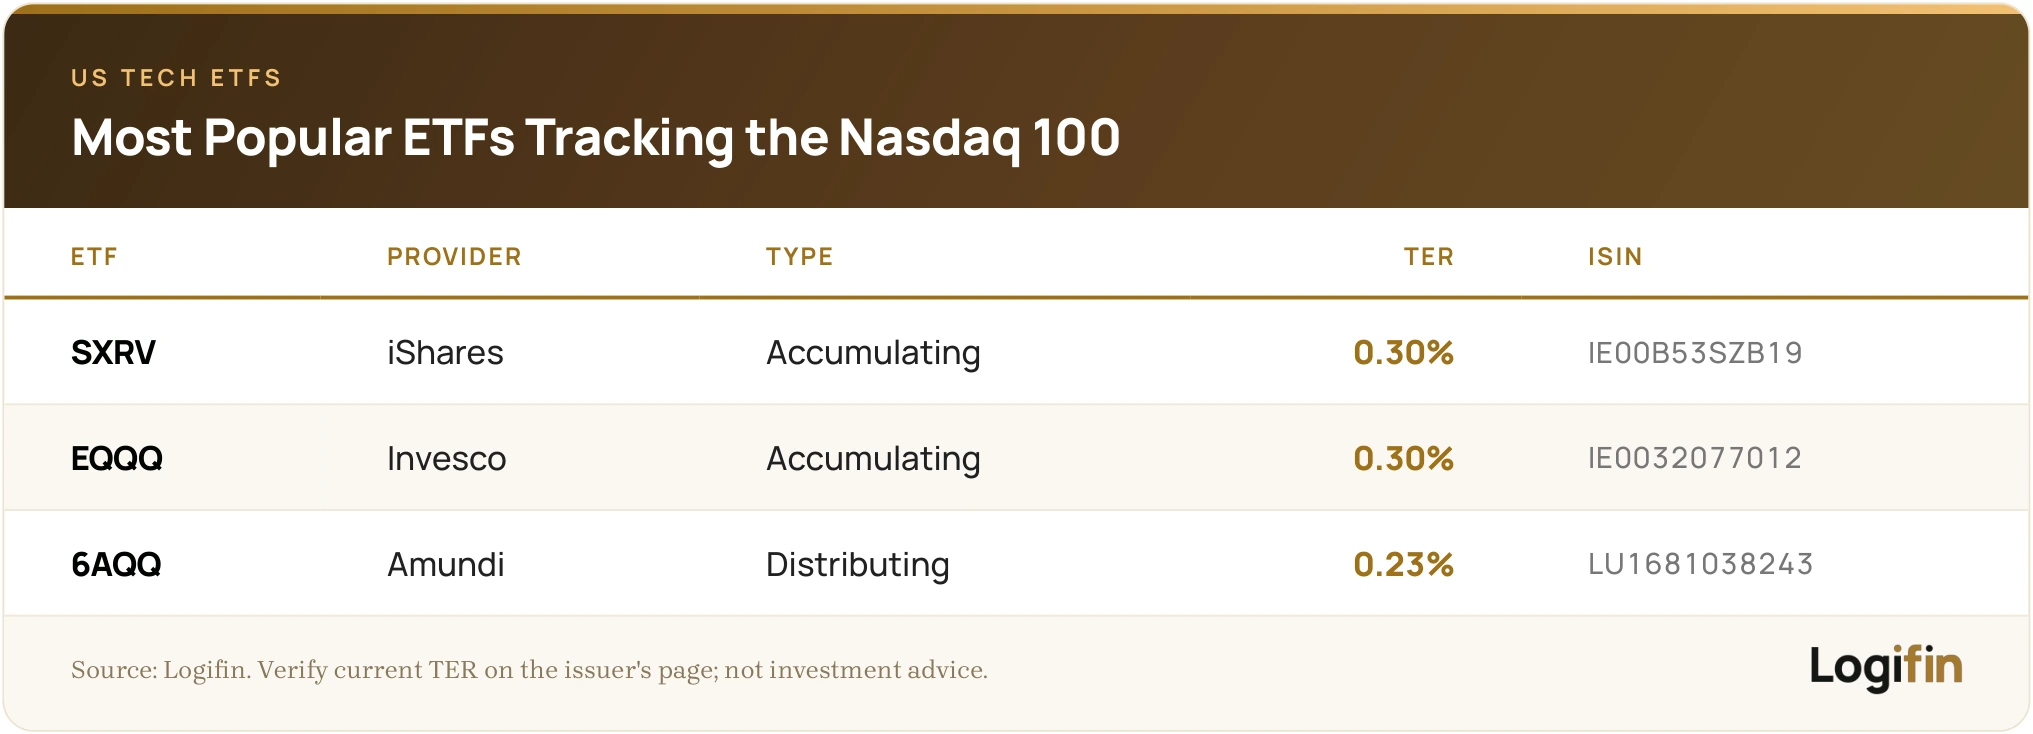
Most ETFs tracking the Nasdaq 100 have a higher TER than core indices such as the S&P 500 or the MSCI World.
This is due to the premium you pay for exposure to high-growth companies.
🔶 Long-term performance of the Nasdaq 100: what the historical data show
Before evaluating the Nasdaq 100 as a possible satellite or growth choice in your portfolio, it is worth examining how it has moved historically.
The long-term performance of the Nasdaq 100 highlights three key points:
- Strong long-term growth when markets favour technology. The Nasdaq 100 benefits disproportionately from positive technology trends, which lets it outperform during periods of economic expansion.
- Large swings during periods of uncertainty. The index records sharper declines during periods of rising rates or regulatory pressure, especially when high-growth companies are affected.
- Fits better as a satellite rather than a core choice. The concentration in a few mega-cap companies increases risk. For many investors the Nasdaq 100 works ideally as a complementary choice that adds a growth bias to the portfolio.
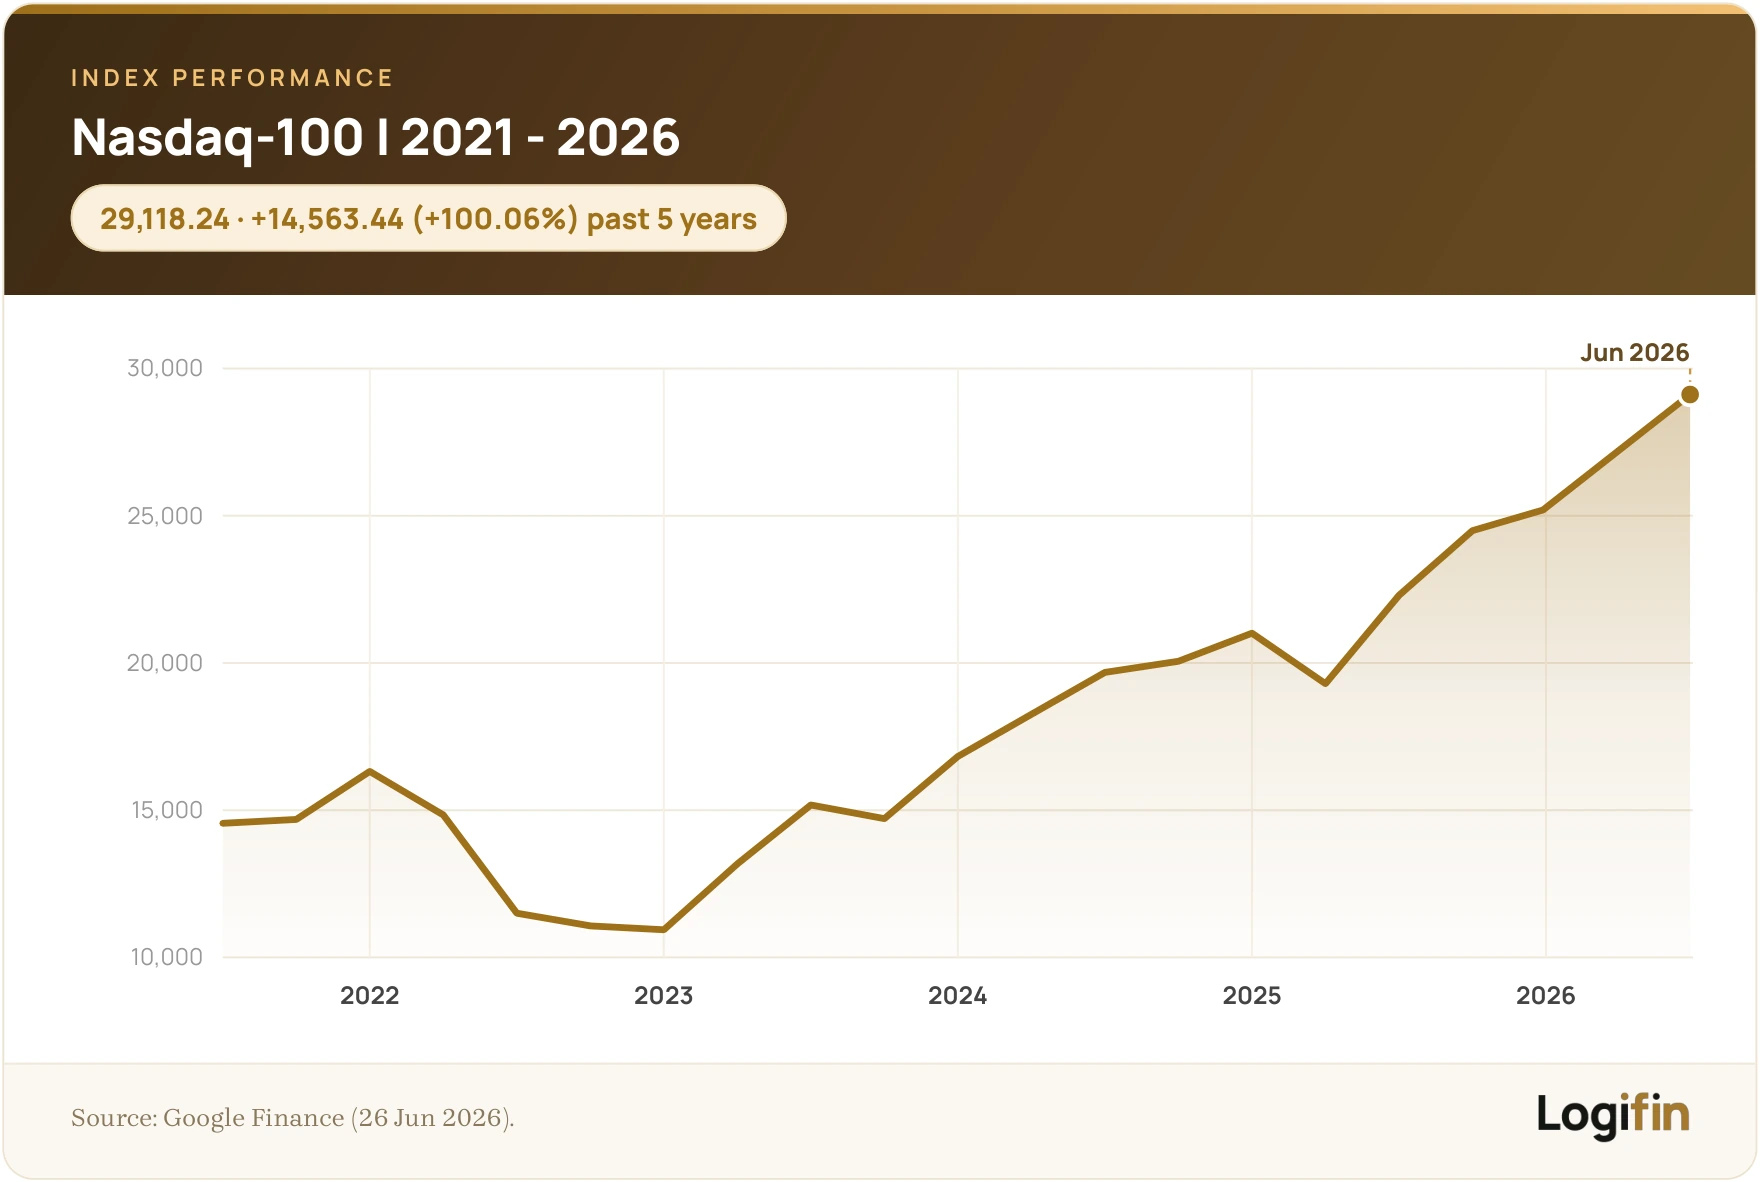
Therefore:
- Over the five years 2021–2026 the Nasdaq 100 nearly doubled in value (+107.77%), reflecting the strong growth of mega-cap technology companies.
- Despite the sharp declines of 2022, the index returned to a new upward pattern, showing how powerful a role the earnings of Apple, Microsoft, Nvidia, Amazon and other pillar companies play.
- The index’s performance is impressive, but it comes with higher volatility than more diversified indices such as the S&P 500.
🔶 Who can make the most of it?
This index suits:
- Younger investors with a long-term horizon and tolerance for volatility
- Those who want to add a “growth component” to a balanced portfolio
- Those who use DCA and see corrections as an opportunity
In short, the Nasdaq 100 is a powerful tool for investors who want growth, can withstand volatility and can stay committed to their strategy regardless of the market’s short-term “waves”.
Euro Stoxx 50 – The European “player” on the list
The Euro Stoxx 50 is the leading index of the Eurozone and is often presented as the “S&P 500 of Europe”.
It represents the 50 largest listed companies from the strongest economies of the euro area.
Although it lacks the global influence of the S&P 500 or the MSCI World, it is a key pillar for those investing in the European economy or seeking geographic balance in their portfolio.
🔶 What does it include?
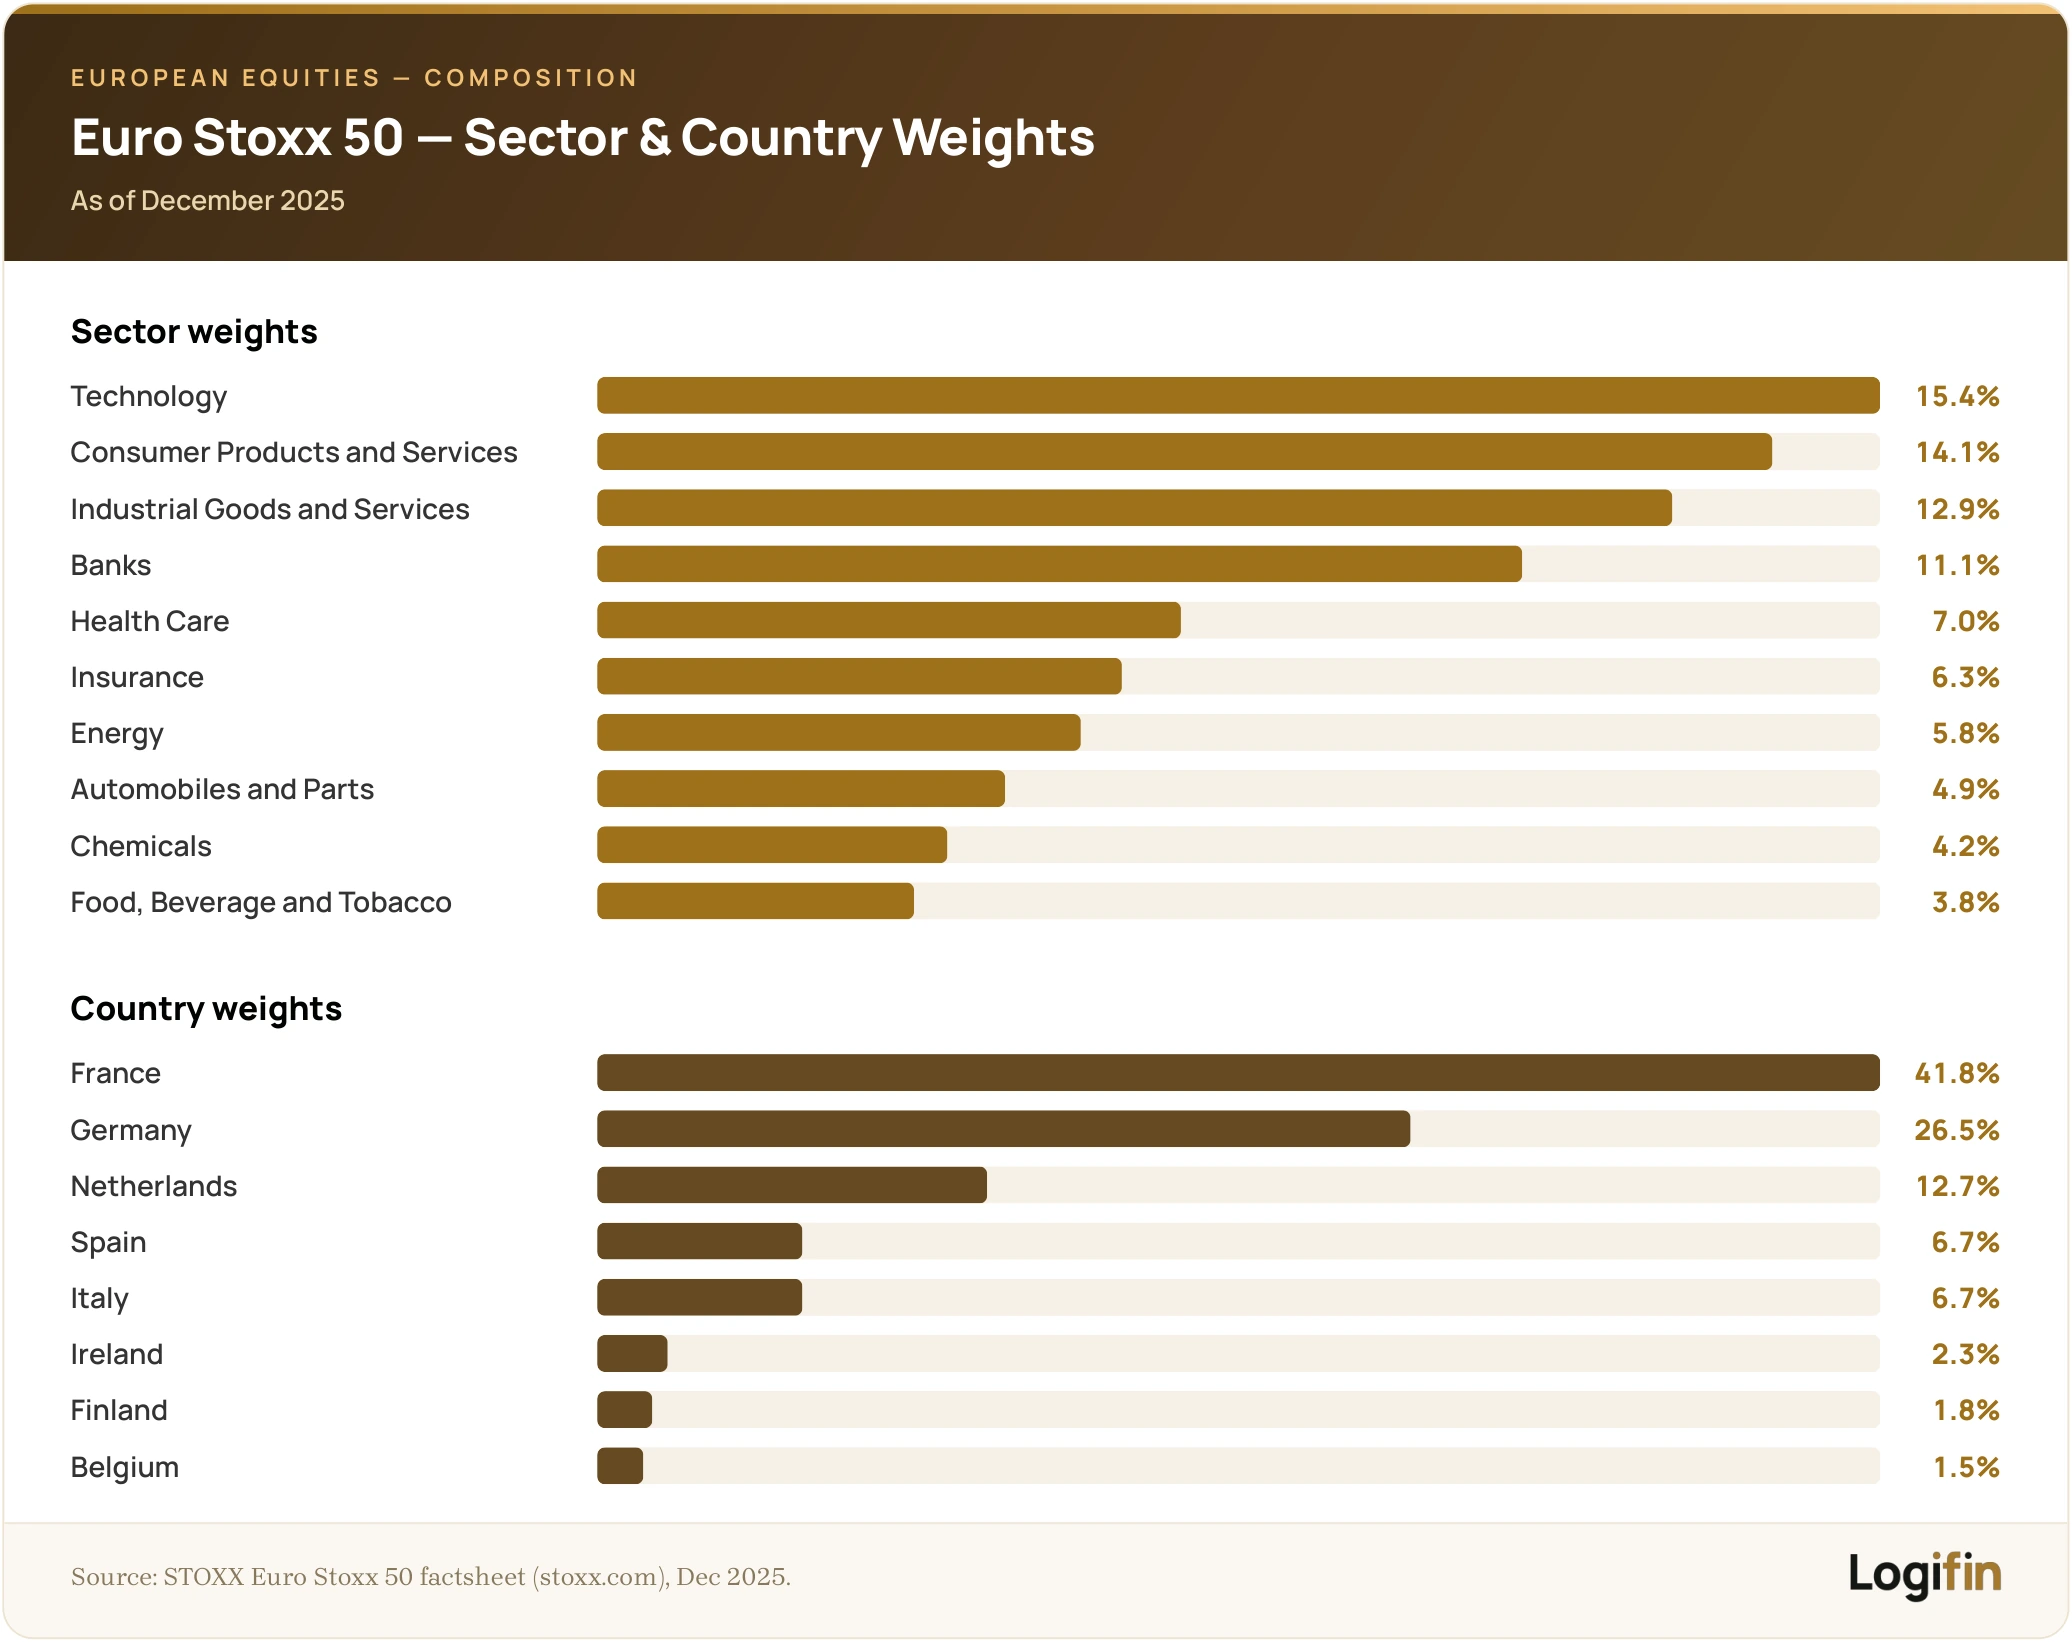
The Euro Stoxx 50 includes companies from 11 Eurozone countries, with the greatest weight held by:
- France (e.g. LVMH, TotalEnergies, Airbus)
- Germany (e.g. Siemens, SAP, Allianz)
- Spain (e.g. Banco Santander, Iberdrola)
- Netherlands (e.g. ASML, ING)
The index composition is based on market capitalisation, with periodic rebalancing to maintain representativeness.
🔶 What does the Euro Stoxx 50 offer an investor?
The Euro Stoxx 50 is one of Europe’s most important indices and captures the “heart” of the European economy.
For the investor it works as a simple yet targeted solution combining stability, diversification and exposure to leading Eurozone companies.
- It provides exposure to the core of the European economy. The index includes 50 of the largest and most influential Eurozone companies, covering a significant share of the region’s economic activity.
- It offers diversification against U.S.-dominated indices. Portfolios based exclusively on U.S. indices (such as the S&P 500 or Nasdaq 100) often show high geographic concentration. The Euro Stoxx 50 acts as a “counterweight” and reduces dependence on the U.S. market.
- It allows targeting European blue chips. It includes top companies in industry, energy, banking and consumer goods. These companies usually offer stable fundamentals and predictable cash flows, which helps portfolio stability.
- An ideal choice for European investors. For those who want a geographically “familiar” ETF or wish to balance U.S. dominance in their portfolio, the Euro Stoxx 50 is a sensible and proven choice. It fits both core allocations and satellite positions, depending on the strategy.
🔶 Which ETFs track it?
Some of the most well-known and reliable ETFs tracking the Euro Stoxx 50 are:
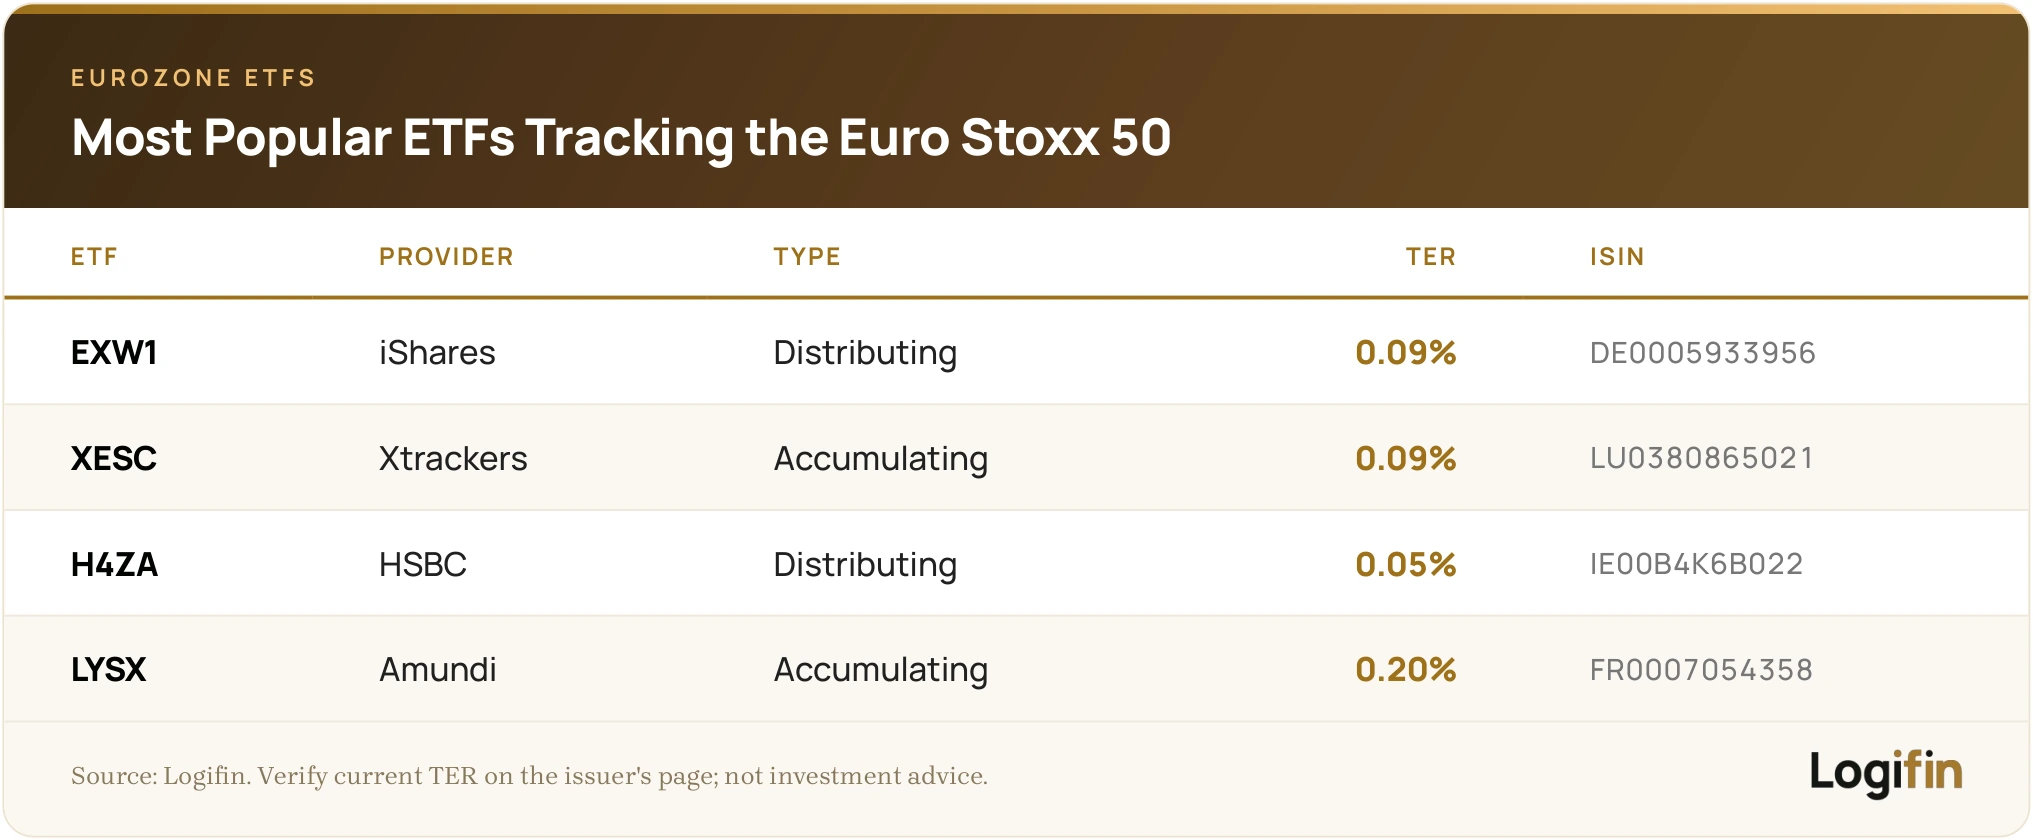
All are UCITS-compliant and available through European platforms, in EUR.
🔶 Long-term performance of the Euro Stoxx 50: what the historical data show
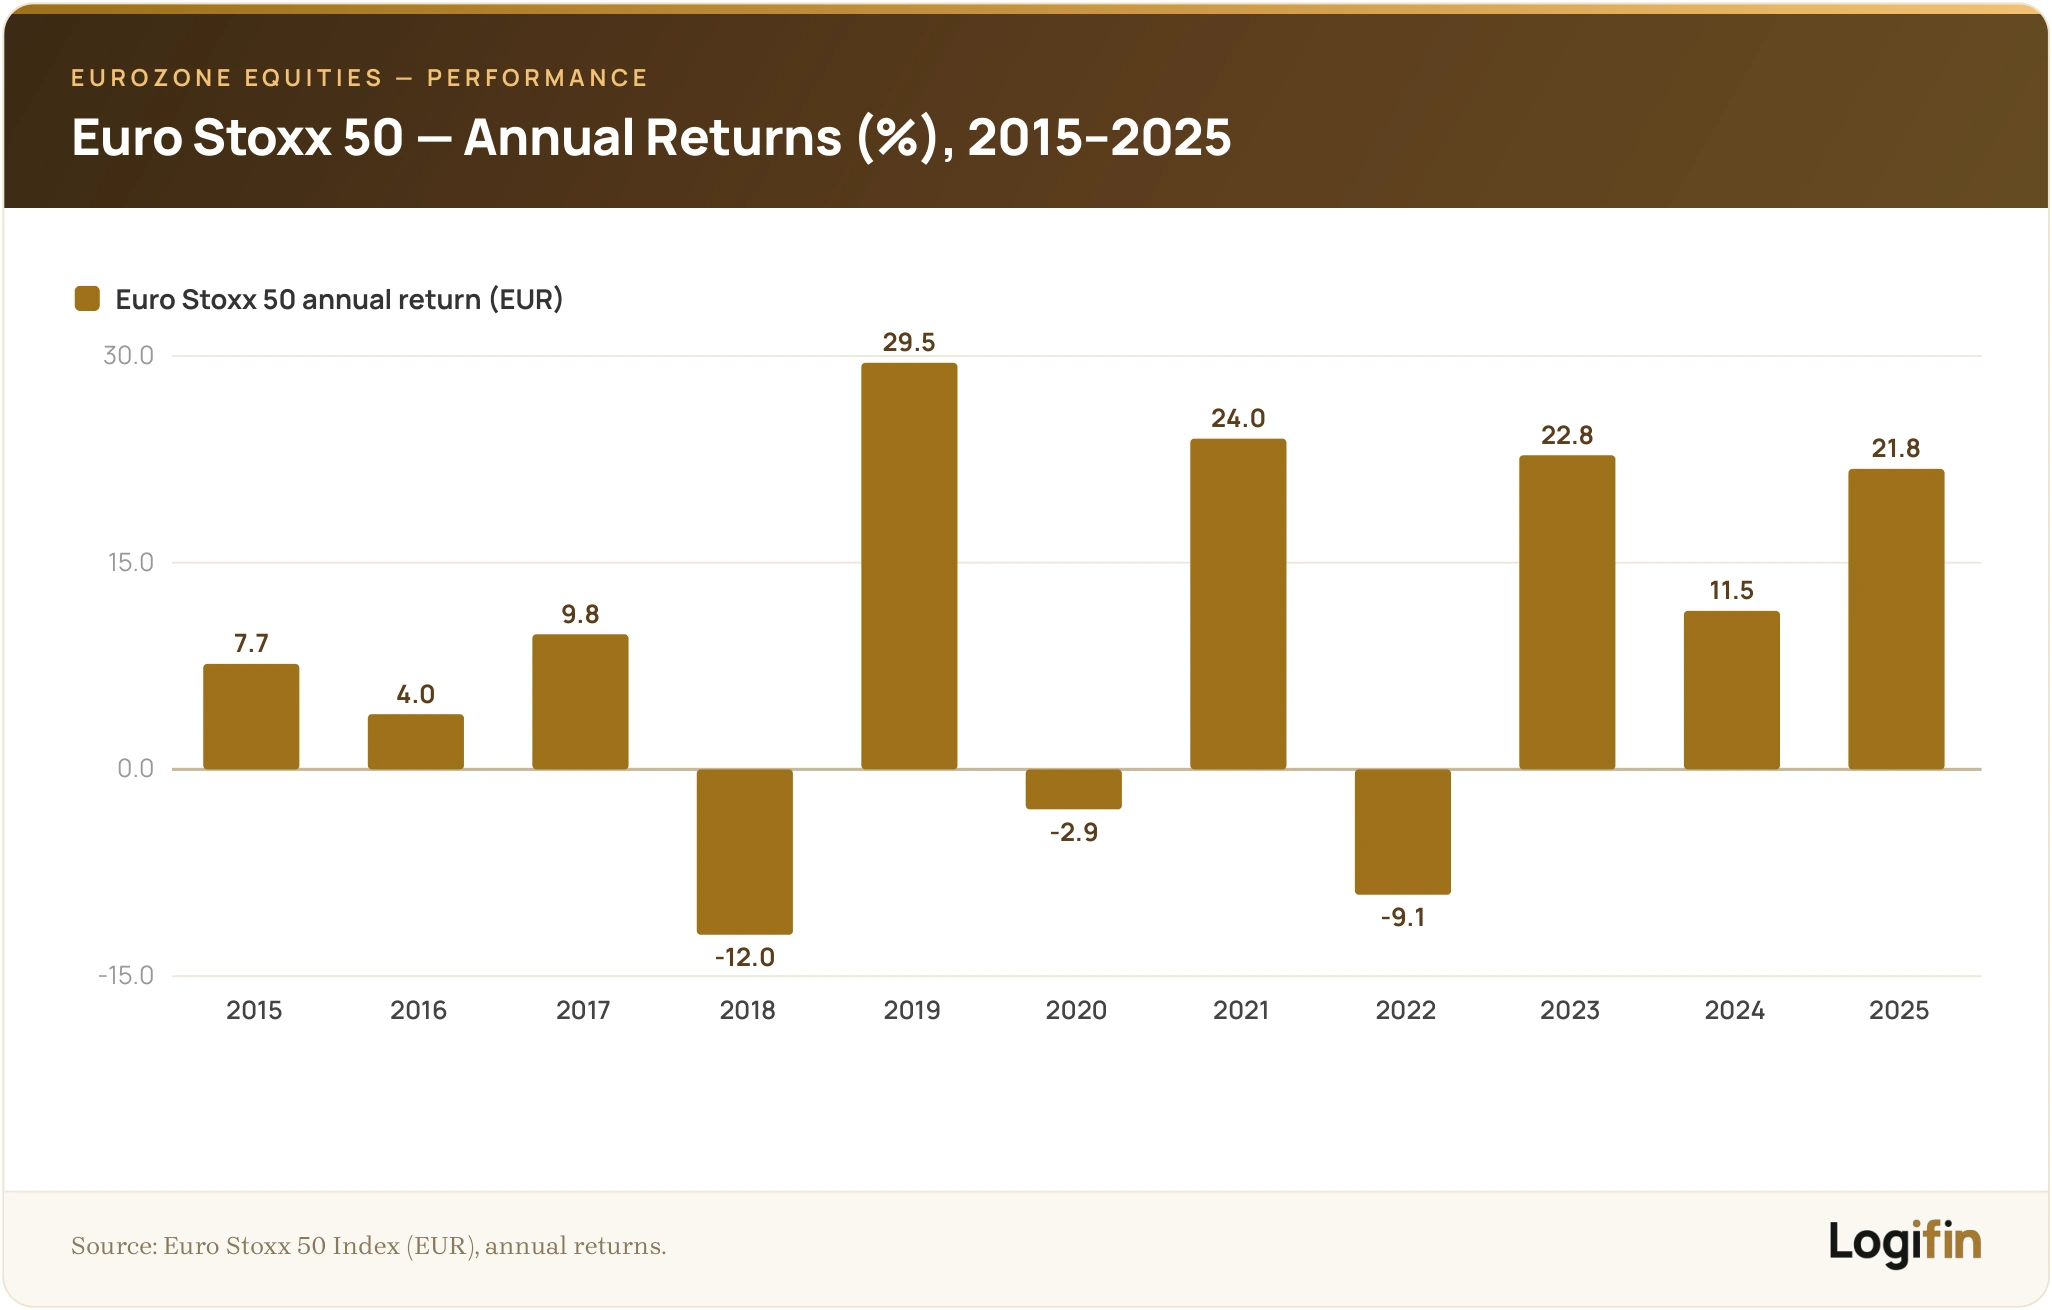
The Euro Stoxx 50 brings together the top blue-chip companies of the Eurozone and acts as a barometer for the European economy.
The long-term performance of the Euro Stoxx 50 highlights three key points:
- Stability with a milder growth profile. Unlike the U.S. technology market, the Euro Stoxx 50 moves more steadily, offering lower volatility but also lower potential upside. It is an index that suits more conservative strategies.
- Resilience in difficult periods. Despite the macroeconomic pressures of the past five years, the index maintained an upward trajectory over time, showing the strength of European blue-chip companies.
- An excellent complement for portfolios with high U.S. exposure. The Euro Stoxx 50 offers geographic diversification and reduces dependence on the U.S. market, strengthening the balance of a global portfolio.
🔶 When might it interest you?
It is worth considering an investment in the Euro Stoxx 50 if:
- You want geographic balance in your portfolio
- You invest with a more conservative profile, preferring stable companies and higher dividends.
- You believe Europe is undervalued and expect a recovery in its economic momentum.
Which index suits you?
Now that we have met the world’s most popular indices, the most important question follows: which one best fits your profile?
There is no single right answer: it depends on what you are after as an investor, your risk tolerance and how you have designed your strategy.
Let us look at how the indices compare and how you can choose based on your needs:
🔶 Comparison of key characteristics
The table below offers a concise comparison of the indices we analysed in this article:
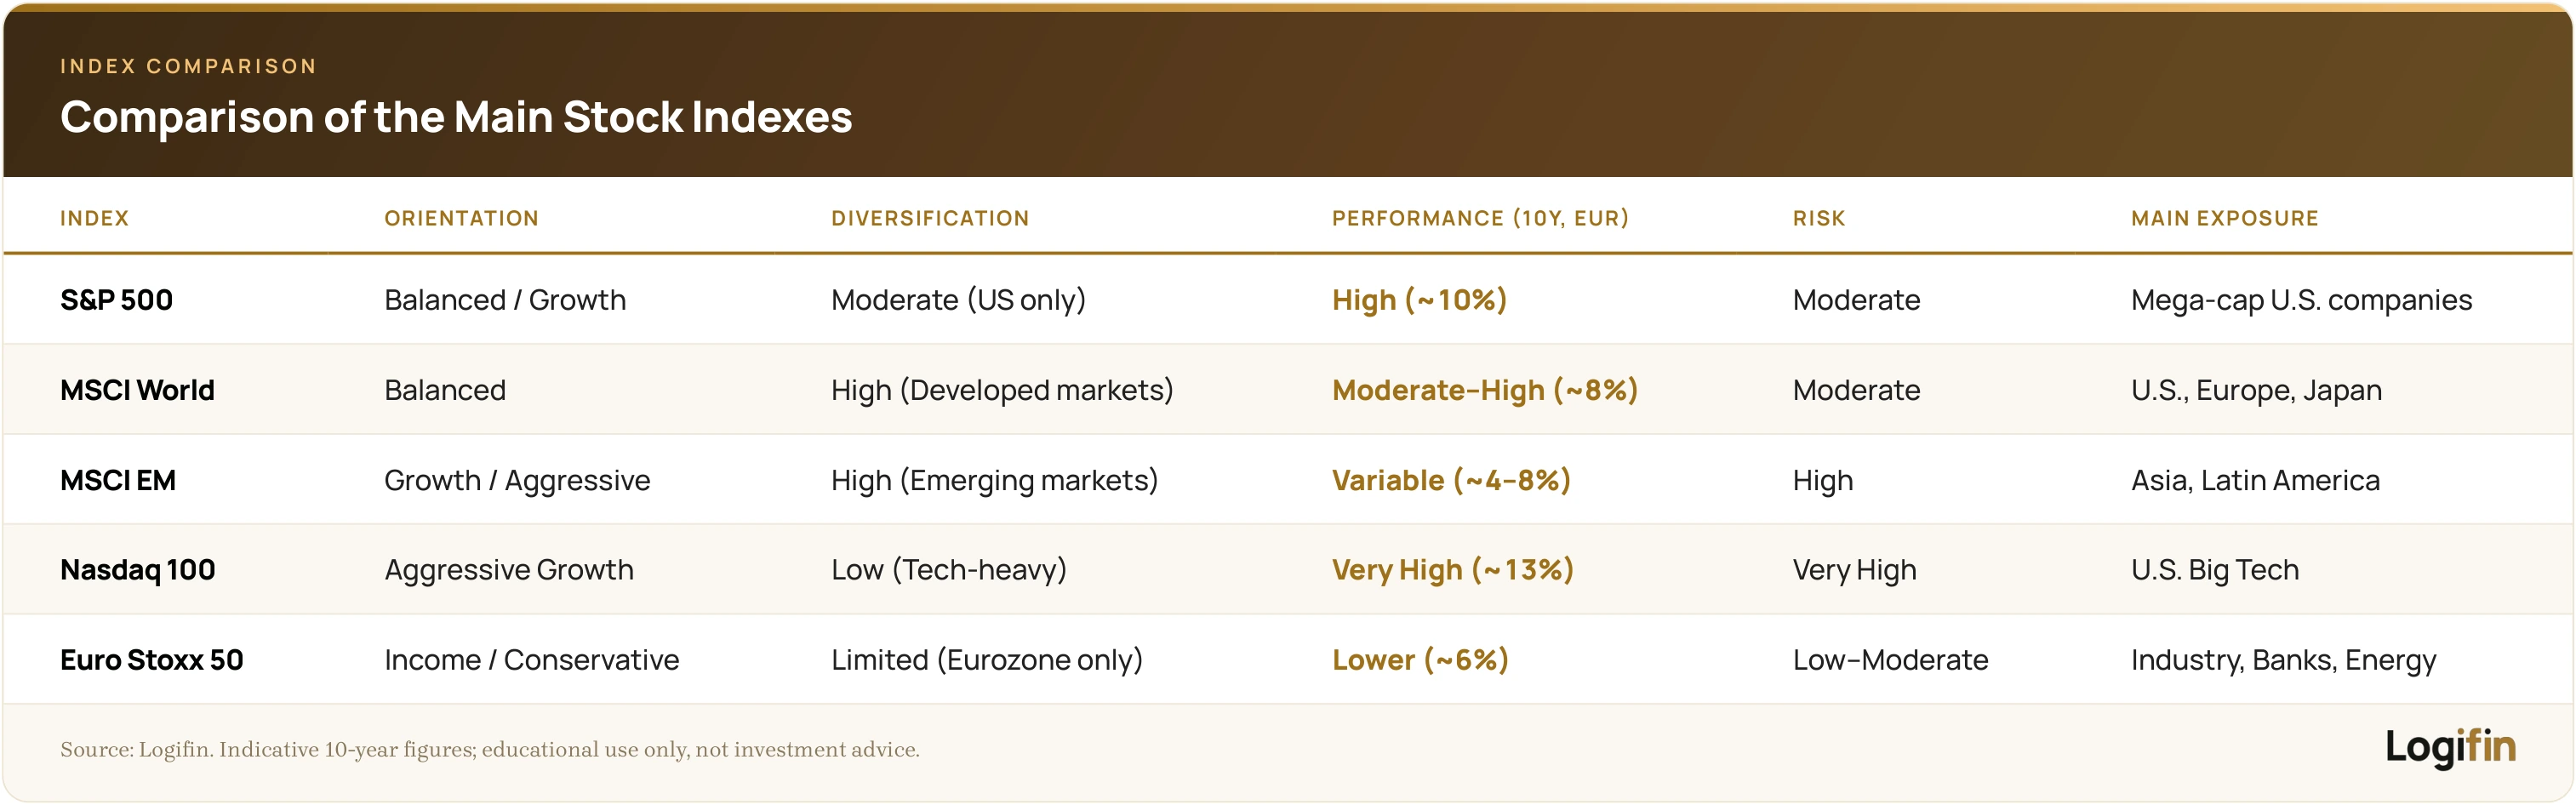
Note: the figures are indicative and based on historical performance, not forecasts.
🔶 Choosing based on your profile
The right index choice is not about “which performs best”, but which fits the way you invest, the risk you can take and the expectations you have for the future.
The guide below works like a quick compass to identify which index fits your profile.
🔶 You are a beginner and want “the whole world in 1 ETF”
- Include the MSCI World in your investments
- The simplest, cleanest and most stable solution for global diversification through developed markets.
- It offers predictability, lower volatility and makes an excellent core.
- If you combine it with MSCI Emerging Markets, you cover almost the entire global market.
🔶 You want exposure to the planet’s most dynamic markets
- Include the MSCI Emerging Markets in your investments
- It provides access to fast-growing economies with higher potential upside.
- It comes with more volatility, but suits investors with a long-term horizon who use DCA.
🔶 You believe in technology and want pure exposure
- Include the Nasdaq 100 in your investments
- It focuses on innovation and the companies driving the digital transition.
- It has impressive historical performance but requires tolerance for sharp swings.
- Suitable for long-term growth and for investors unaffected by short-term noise.
🔶 You want core exposure with proven stability
- Include the S&P 500 in your investments
- The most popular index in the world, with strong fundamentals and a steady long-term path.
- It works excellently as a primary portfolio pillar and suits every investor profile.
🔶 You are looking for European exposure or want to reduce U.S. bias
- Include the Euro Stoxx 50 in your investments
- Strong exposure to the top blue chips of the Eurozone.
- A good choice for investors who believe in a European recovery, want geographic diversification or favour a dividend strategy.
🔶 How to combine indices in your portfolio
One of the biggest advantages of ETFs is that they let you build a portfolio with complete flexibility. You do not have to pick a single index or focus on one region.
With the right structure you can combine stability, growth and diversification in a single, balanced plan.
The most popular approach is the core & satellite strategy, which splits the portfolio into two levels:
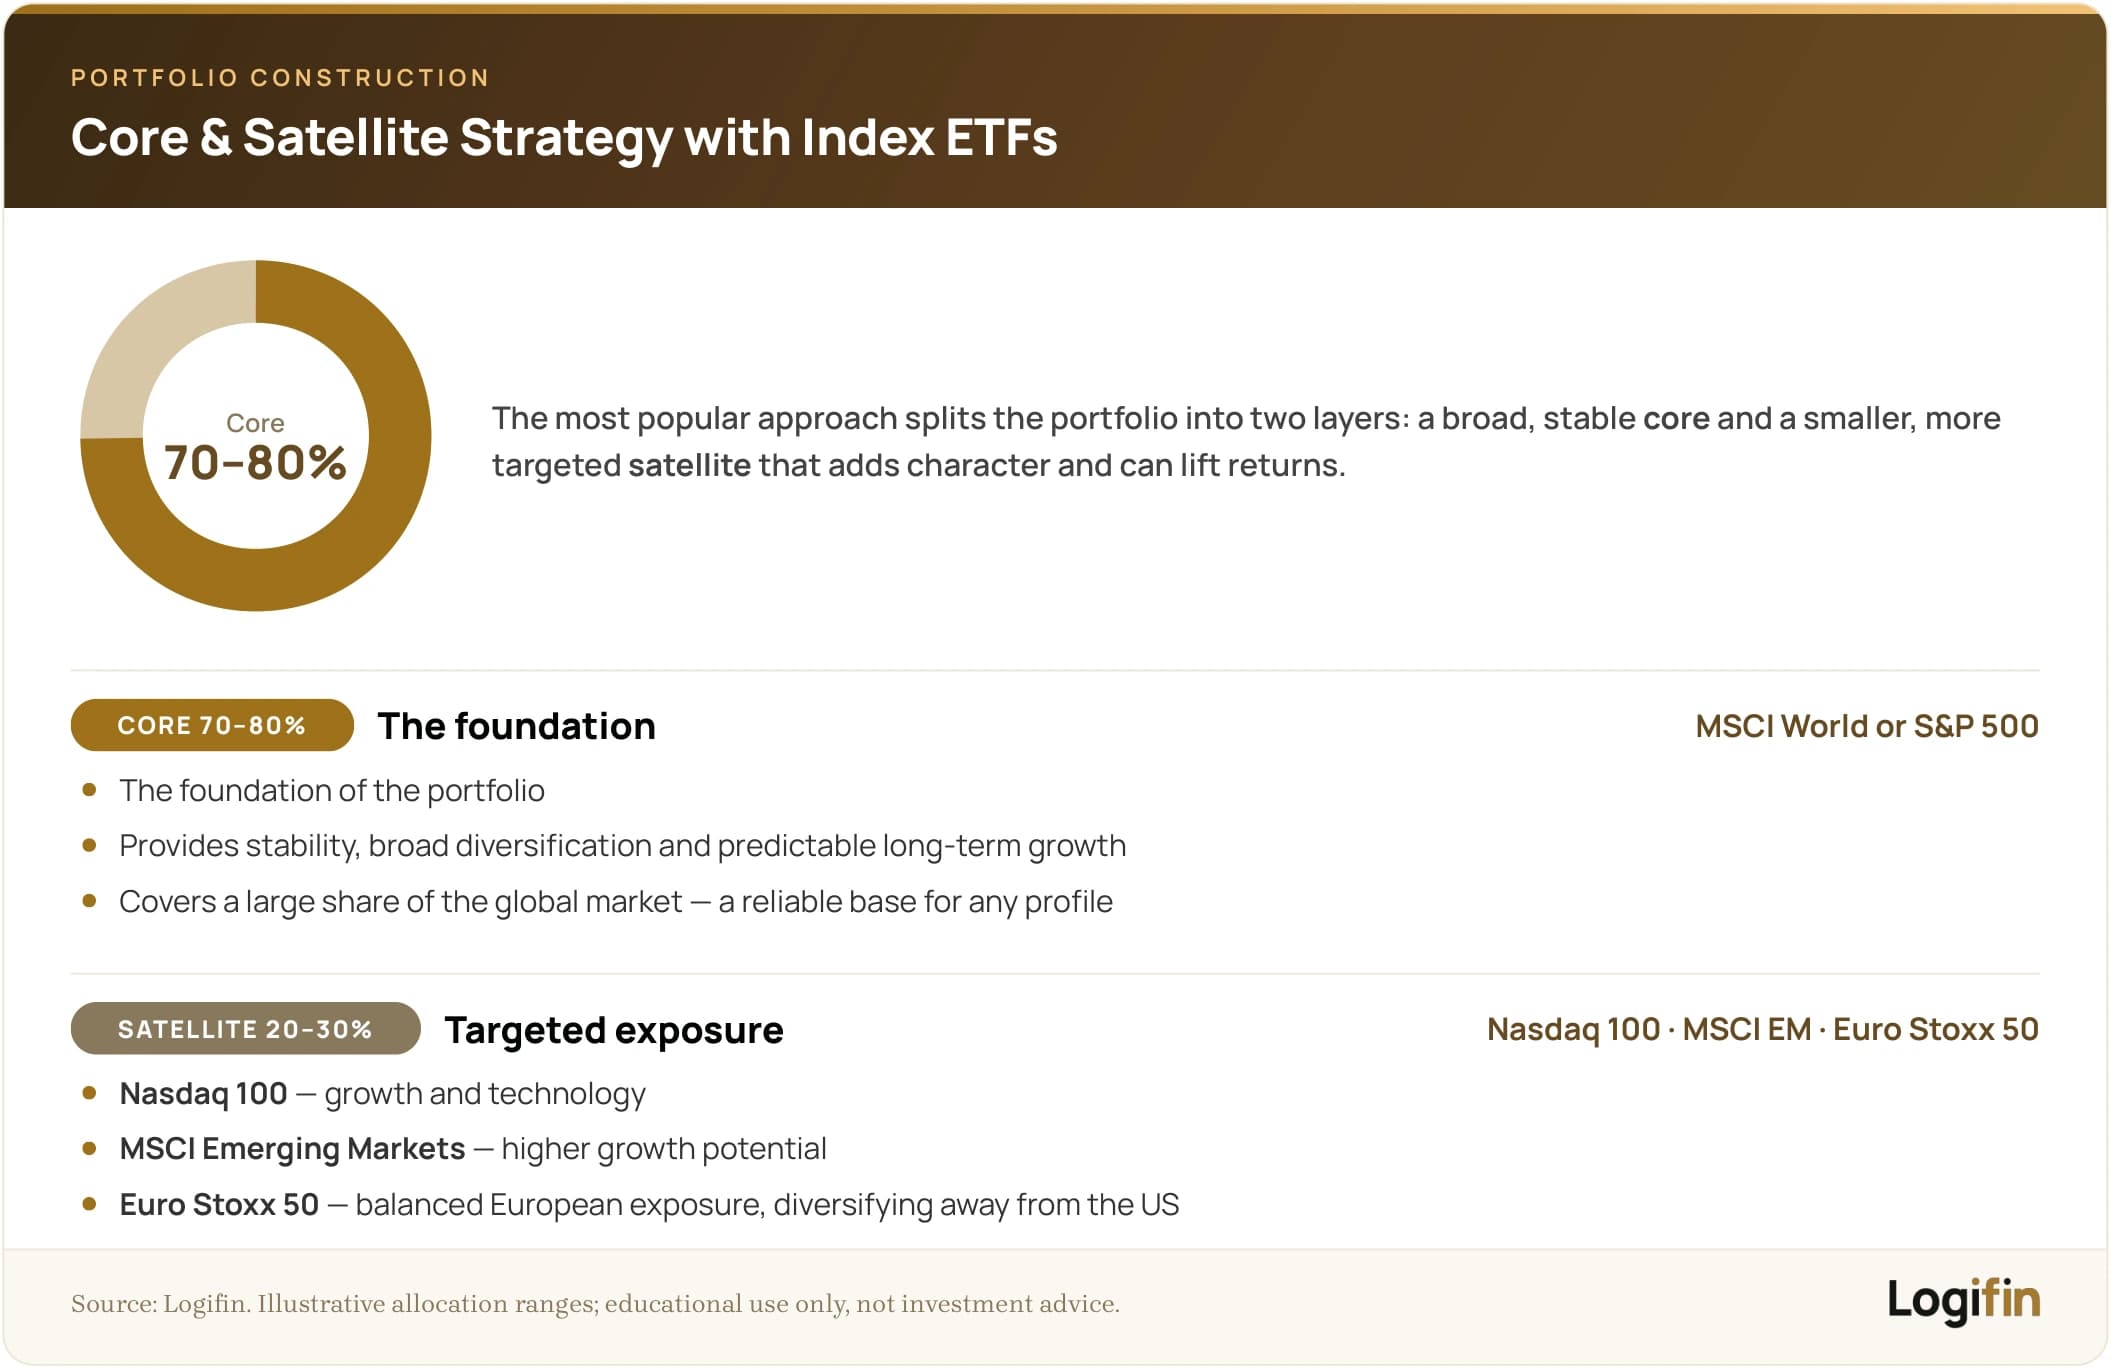
🔶 Core (70–80%) → MSCI World or S&P 500
- This is the “foundation” of the portfolio.
- The core’s role is to provide stability, broad diversification and predictable long-term growth.
- Indices such as the MSCI World and the S&P 500 cover a large share of the global market and act as a reliable base for any investor profile.
🔶 Satellite (20–30%) → Nasdaq 100, MSCI EM or Euro Stoxx 50
The satellite portion lets you give your portfolio character and boost its return with more targeted exposures:
- Nasdaq 100 for growth and technology
- MSCI Emerging Markets for higher growth potential
- Euro Stoxx 50 for balanced European exposure and diversification away from the U.S.
The satellite percentage depends on the risk you can take, your time horizon and your goal.
🔶 What to watch before you decide
- Where you are taxed (some indices/ETFs have more favourable tax treatment)
- Whether you prefer an accumulating or distributing ETF
- Whether you invest via DCA or lump sum
- Which ETFs are available and cost-effective on your broker
- Whether the geographic exposure you choose matches the economic cycles you “see” ahead
Conclusion and practical takeaways
Indices are the market’s "map": they show you where value sits, how it is distributed and what exactly you are buying when you pick an ETF.
The goal is not to find the "best" index, but the one (or the combination) that fits your own goal and risk profile.
🔑 Key takeaways:
- Each index answers a different need: the S&P 500 for exposure to the world’s largest market, MSCI World for global diversification, Nasdaq 100 for technology/innovation, MSCI Emerging Markets for developing economies and Euro Stoxx 50 for euro-denominated European exposure.
- "Global" does not always mean balanced: MSCI World holds over 72% US. Check the composition, not just the name.
- Concentration exists even in the big indices: in the S&P 500, the 10 largest companies account for roughly 36% of the index.
- Spectacular returns in one period (like Nasdaq 100’s +107% in 2020–2025) come with correspondingly higher volatility and they are no guarantee of what comes next.
Practical Tips:
-
Look "under the hood" before you choose.
Before buying an ETF on any index, review its geographic and sector composition and its top 10 holdings: that is where your real risk hides.
-
Start with a broad index as your base.
Many investors build the core of their portfolio (70–80%) on a broadly diversified index and use more targeted indices only as satellites (20–30%).
-
Avoid "hidden duplicates".
If you combine, say, the S&P 500 and the Nasdaq 100, you are buying the same big tech companies twice. Check the overlap before adding a second index.
-
Pick an index based on your goal, not momentum.
The index that "ran" last year is not necessarily the right one for the next 15 years. Your horizon and risk tolerance are the proper compass.

The content of this article is provided exclusively for informational and educational purposes and does not constitute investment advice or a recommendation to buy or sell financial products. The information is based on publicly available sources considered reliable, without any guarantee of accuracy or completeness. Before making any financial or investment decision, it is recommended that you consult a certified professional advisor or accountant, taking into account your own financial situation and risk profile. The Logifin team bears no responsibility for any direct or indirect damages arising from the application of the information presented.
Related articles

Dow Jones vs Nasdaq-100 vs S&P 500: The differences and when to follow each one
The three leading U.S. indices compared on composition, concentration and risk, with guidance on which one is worth following and when.
11 min read

How to choose between ETFs that track the same index
VUAA, SXR8, D500 – all track the S&P 500. Which one is actually worth it?
26 min read

How do economic indicators affect the stock market?
GDP, inflation, unemployment, interest rates: how economic indicators move the stock market and what investors should watch.
15 min read

What is a recession and how it affects investors?
How a recession is defined, what causes one, how the markets usually behave during it and what an investor can do to prepare in advance.
24 min read
EXPLORE LOGIFIN
Everything you need in order to learn, plan and track your investments.
Logifin Blog
Learn everything you need to get your finances in order and invest with confidence.
Logifin Insights
What moves the markets and what it means for a long term investor. Short and without the noise.
Logifin Tools
Free, inside the site, no signup. Everything you calculate stays on your device.
Logifin ETF Hub
Find the ETF that fits you: 550+ UCITS ETFs, smart filters and in-depth comparisons.
Logifin Guides
A series of guides that builds your investment plan step by step. The first guide is free for everyone.
Logifin Circle
The tools and the Hub are free for everyone. You become a member for the intelligence that never stops.