Dow Jones vs Nasdaq-100 vs S&P 500: The differences and when to follow each one
The three leading U.S. indices compared on composition, concentration and risk, with guidance on which one is worth following and when.
30 August 2025 · 11 min read

What are stock market indices?
Stock market indices are the market’s basic “barometers”: they represent the movement of a group of stocks and capture, in a single number, the general trend of the economy or of a specific sector.
The three best-known U.S. indices (the Dow Jones, the Nasdaq-100 and the S&P 500) differ in their composition, weighting and philosophy, which is why they often move differently.
They are not merely statistics that appear on the news; they are reference tools used daily by investors, analysts and economists to interpret the market and compare returns.
Example:
- When we hear that “Wall Street closed higher”, we almost always refer to the movement of major indices, such as the Dow Jones, the Nasdaq or the S&P 500.
- With a single phrase we can describe the trend of thousands of stocks, without having to look at each one separately.
🔶 Why Do They Matter?
- They condense the movement of hundreds of stocks into a single number, simplifying the picture.
- They help investors assess the state of the economy or the course of a sector (e.g. technology, energy).
- They are used as benchmarks: that is, as a yardstick for comparing portfolios, mutual funds or ETFs.
- They enable historical analysis: by studying how the indices moved in past crises or growth periods, investors draw conclusions about today.
Most investors do not compare their returns against individual stocks, but against a benchmark index, such as the S&P 500, which serves as a “yardstick” for the overall market.
Dow Jones: The historic index
The Dow Jones Industrial Average (DJIA) is the oldest and most iconic stock market index in the United States. It was created in 1896 by Charles Dow, co-founder of the Wall Street Journal. It originally included just 12 industrial companies.
Today it has evolved to include 30 of the largest and most representative companies of the U.S. economy, serving as a reference point for the course of Wall Street.
🔶 Composition
The Dow consists of companies considered “blue chips”, that is, large, stable and established businesses with an international presence.
It covers different sectors so as to give a more balanced picture of the economy. For example:
- Technology: Apple, Microsoft
- Industrials: Boeing, Caterpillar
- Healthcare: Johnson & Johnson, Merck
- Financials: Goldman Sachs, JPMorgan Chase
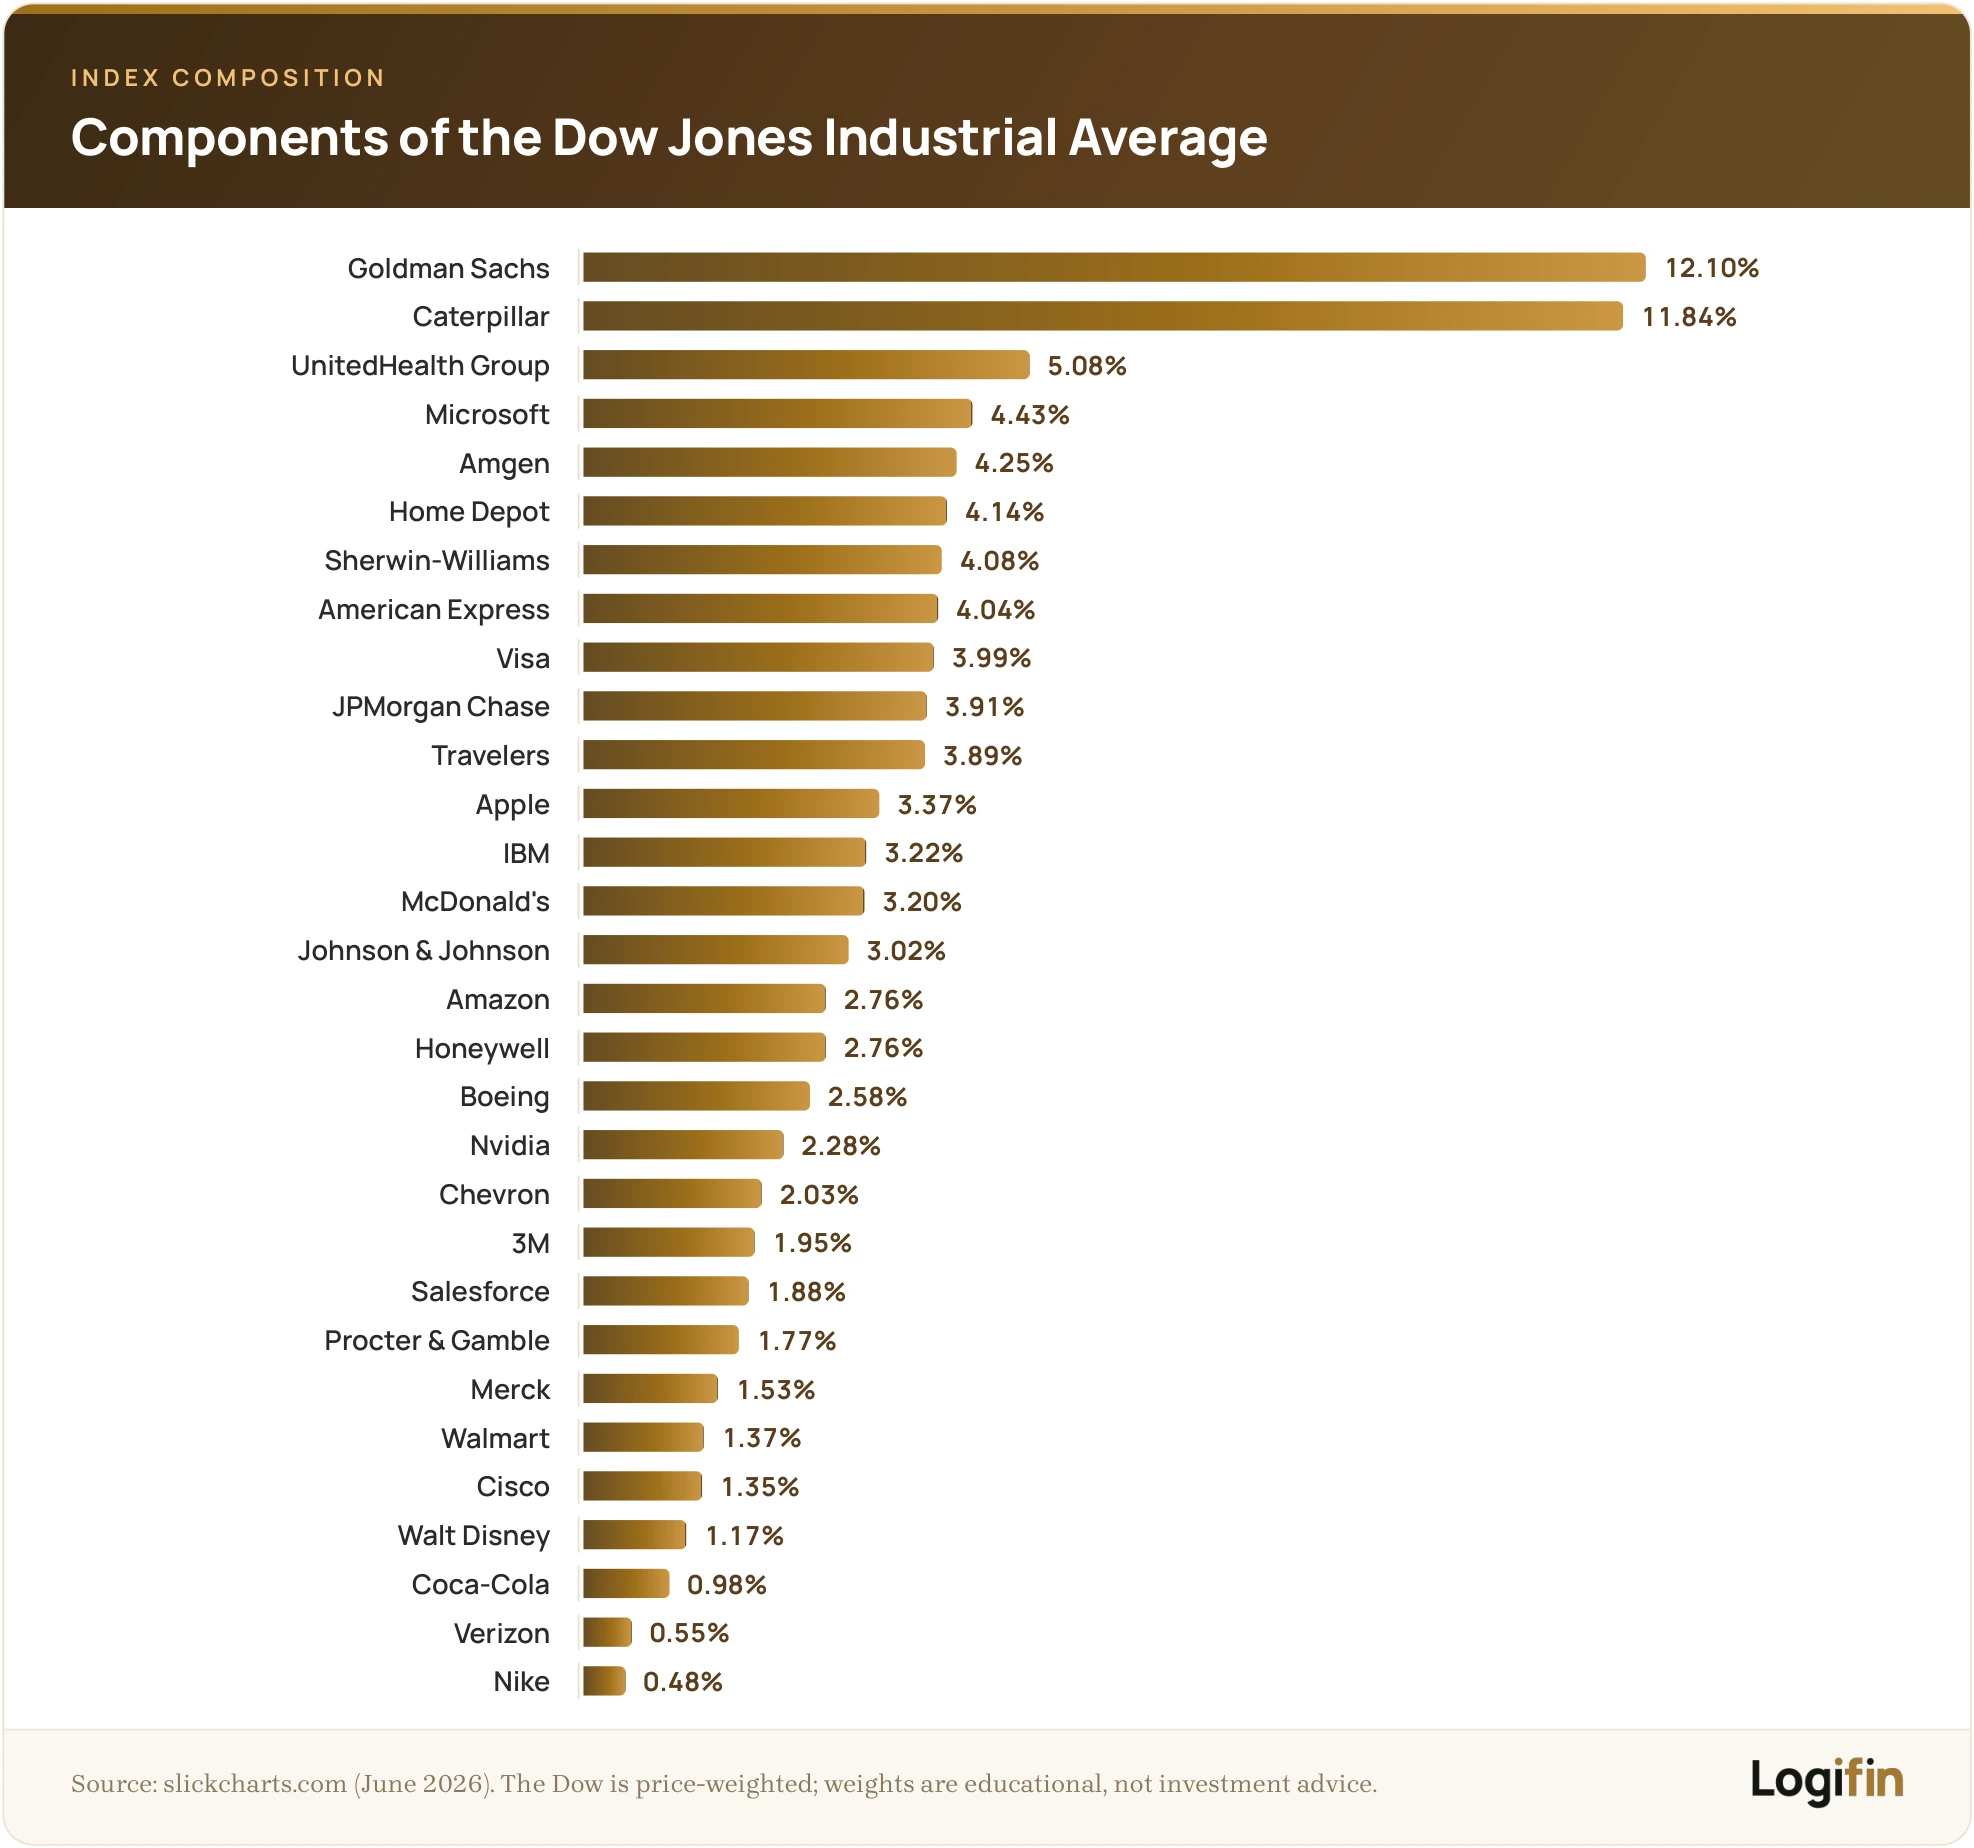
When Apple joined the Dow Jones in 2015, the move was widely interpreted as a symbolic sign of the growing importance of technology companies in the U.S. economy, reflecting the gradual shift from traditional industries towards the digital economy.
🔶 Weighting
Unlike other indices such as the S&P 500, which are weighted by market capitalisation, the Dow Jones is weighted by share price.
This means that a high-priced stock (e.g. $400) has a far greater impact on the index than a lower-priced stock (e.g. $50), even if the latter belongs to a larger company in terms of market capitalisation.
This methodology is considered by many analysts to be “old school” and less representative.
Even so, the Dow remains one of the most recognizable indices in the world and is often used as a reference point.
🔶 What It Represents
The Dow Jones is a showcase index of the U.S. market.
- It does not reflect the entire U.S. economy (it covers just 30 companies, compared with the 500 of the S&P 500).
- It does, however, represent the performance of leading companies regarded as “pillars” of the economy and acts as a symbol of confidence for the markets.
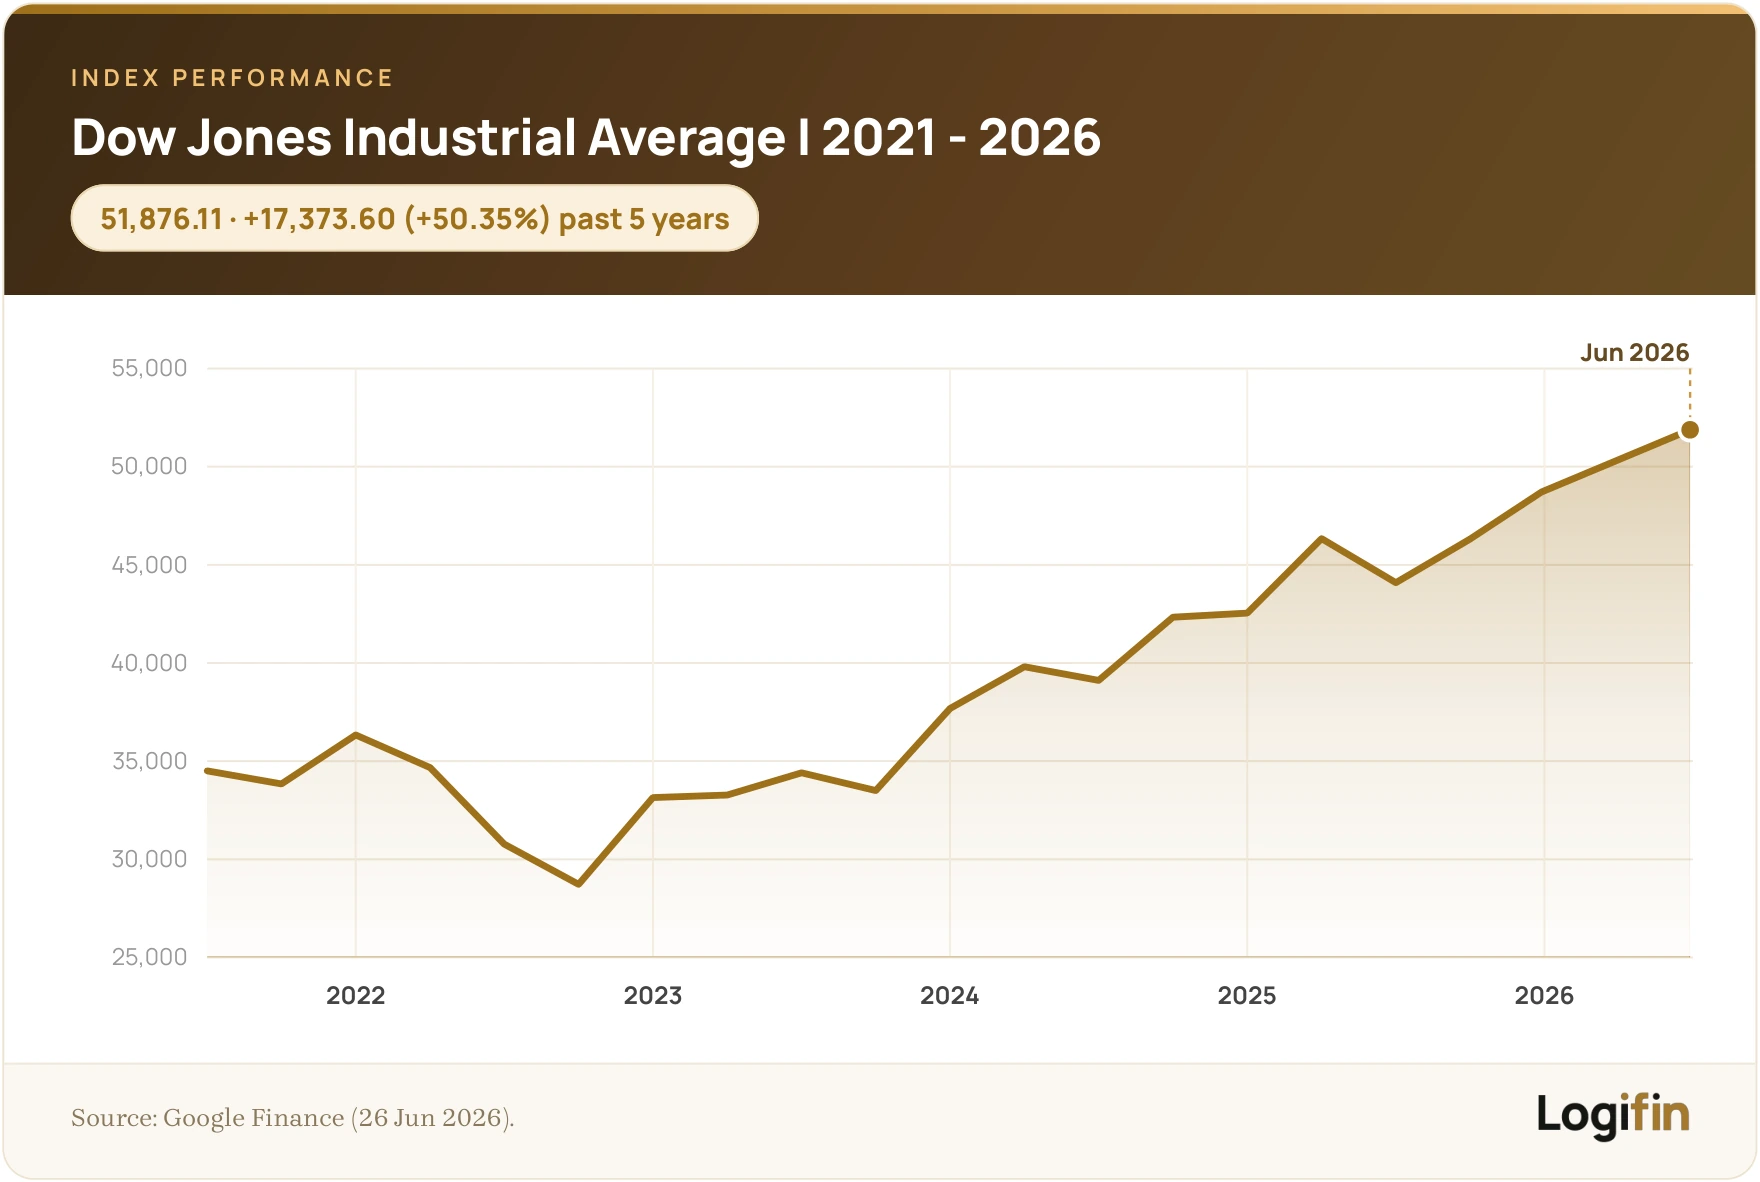
Nasdaq-100: The technology index
The Nasdaq-100 is the stock market index most closely identified with technology, innovation and the growth of the modern U.S. economy.
It was created in 1985 and includes the 100 largest non-financial companies listed on the Nasdaq exchange.
Unlike the Dow Jones, which functions as an index of “traditional stability”, the Nasdaq-100 captures the momentum of companies shaping the future: technology, digital platforms, semiconductors, artificial intelligence and biotechnology.
🔶 Composition
The Nasdaq-100 consists of large-cap companies with a strong growth orientation.
Their common feature is that they do not belong to the financial sector (it does not include banks or insurers).
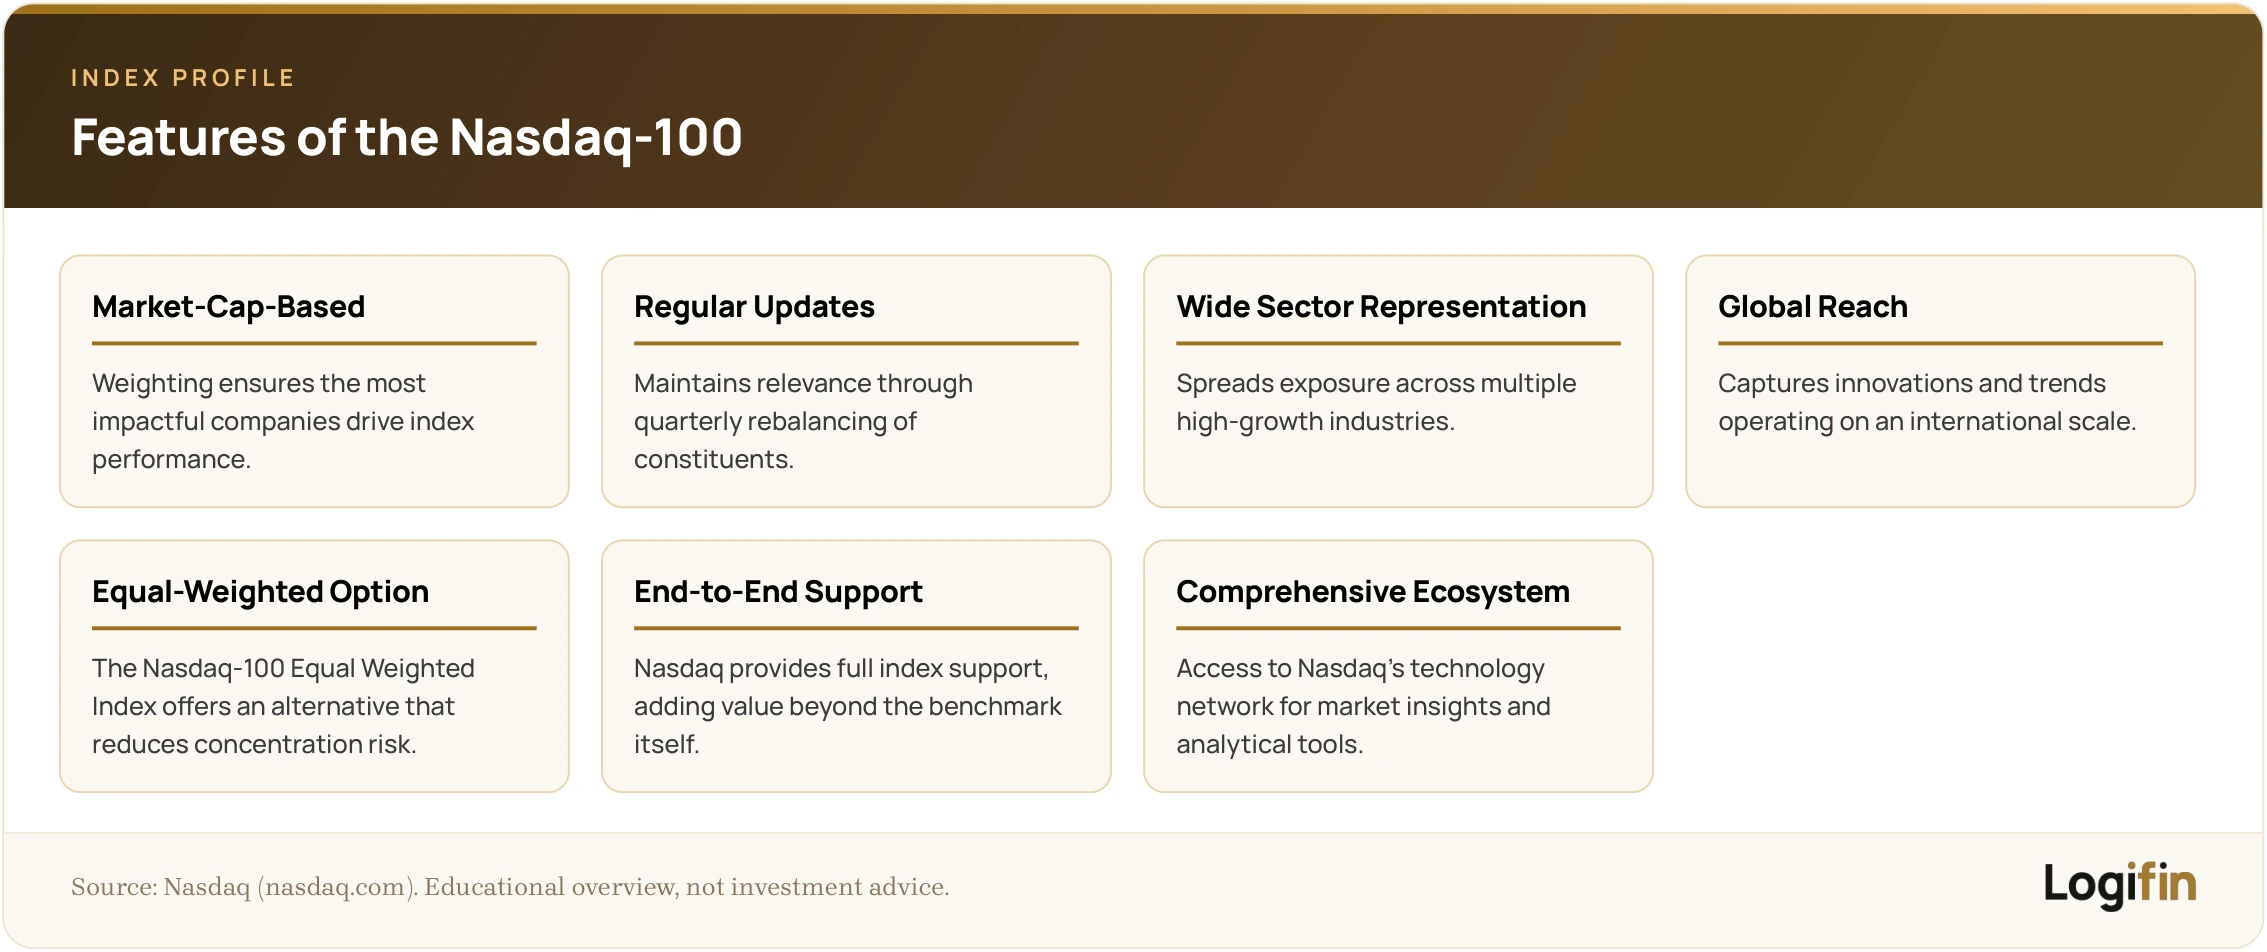
The index mainly covers:
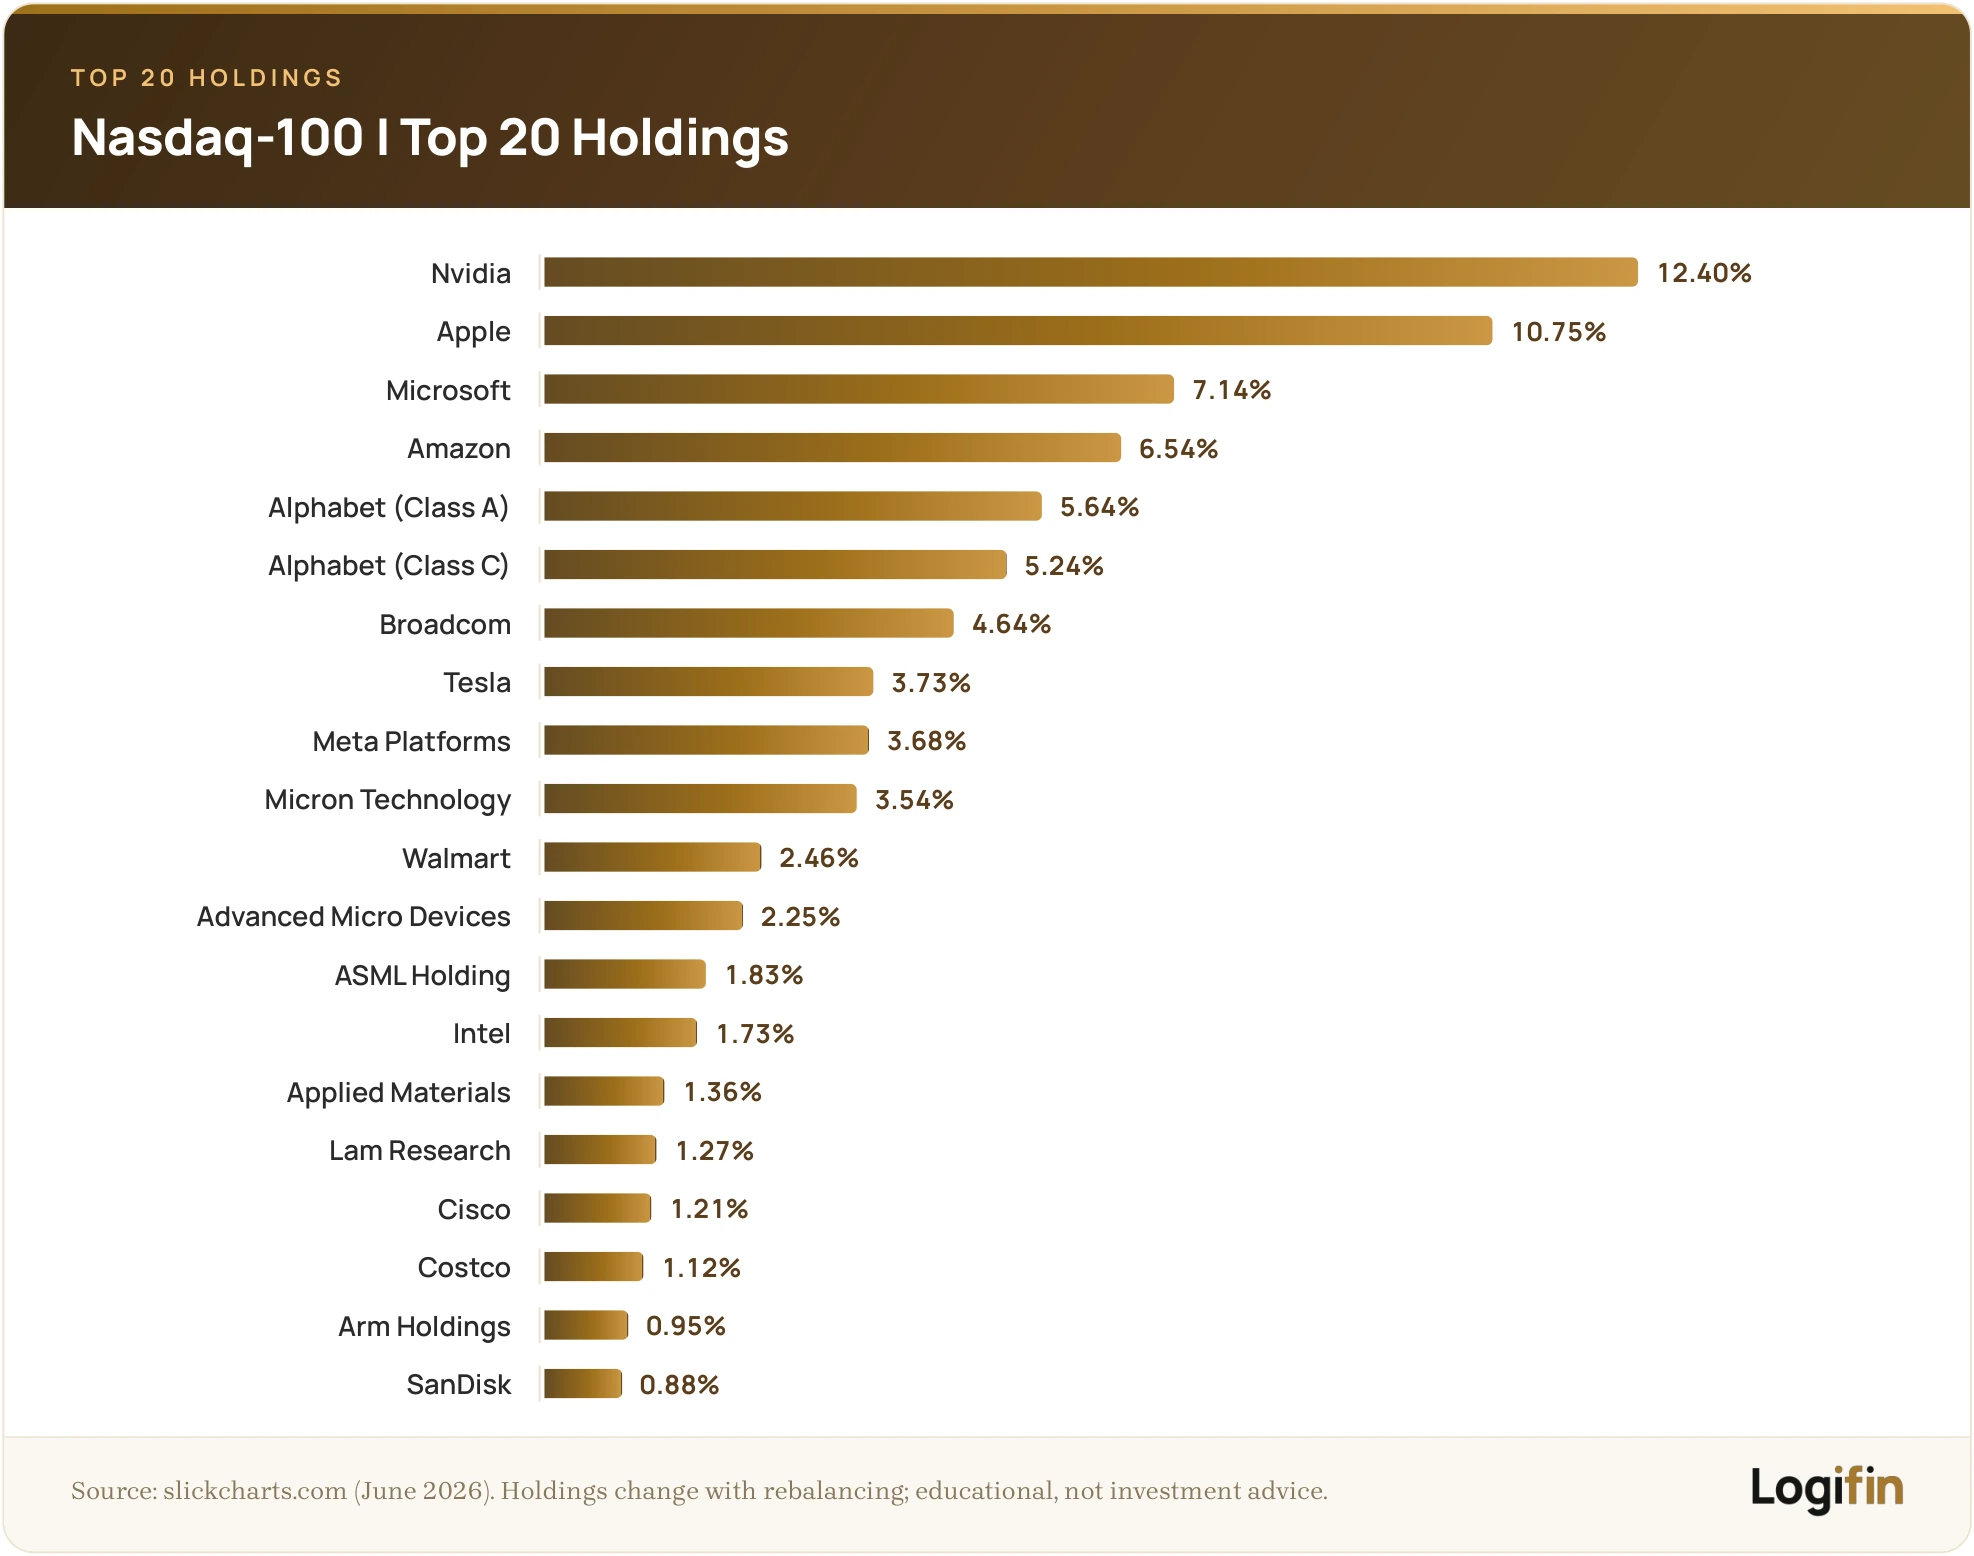
- Technology & software (e.g. Microsoft, Apple)
- Semiconductors & hardware (e.g. NVIDIA, Broadcom)
- Internet & platforms (e.g. Alphabet, Amazon, Meta Platforms)
- Consumer innovation (e.g. Tesla)
- Biotechnology & healthcare (e.g. Amgen, Gilead)
This composition makes the Nasdaq-100 particularly sensitive to technological developments as well as to the market’s expectations about the future.
🔶 Weighting
The Nasdaq-100 is weighted by market capitalisation, but with special concentration-limiting rules.
This means the index tracks the real size of the companies, but without allowing any single stock to dominate excessively.
In practice, this means that:
- Larger companies have greater influence: companies with higher market caps, such as Apple, Microsoft or Nvidia, affect the index’s course more than smaller holdings.
- There is a cap on each stock’s weight: through periodic rebalancing, the index “trims” excessive weights so as to avoid over-concentration in one or two companies, even if those have soared in value.
This methodology is considered more modern and realistic than price weighting, because it better reflects the actual economic footprint of each company.
🔶 What It Represents
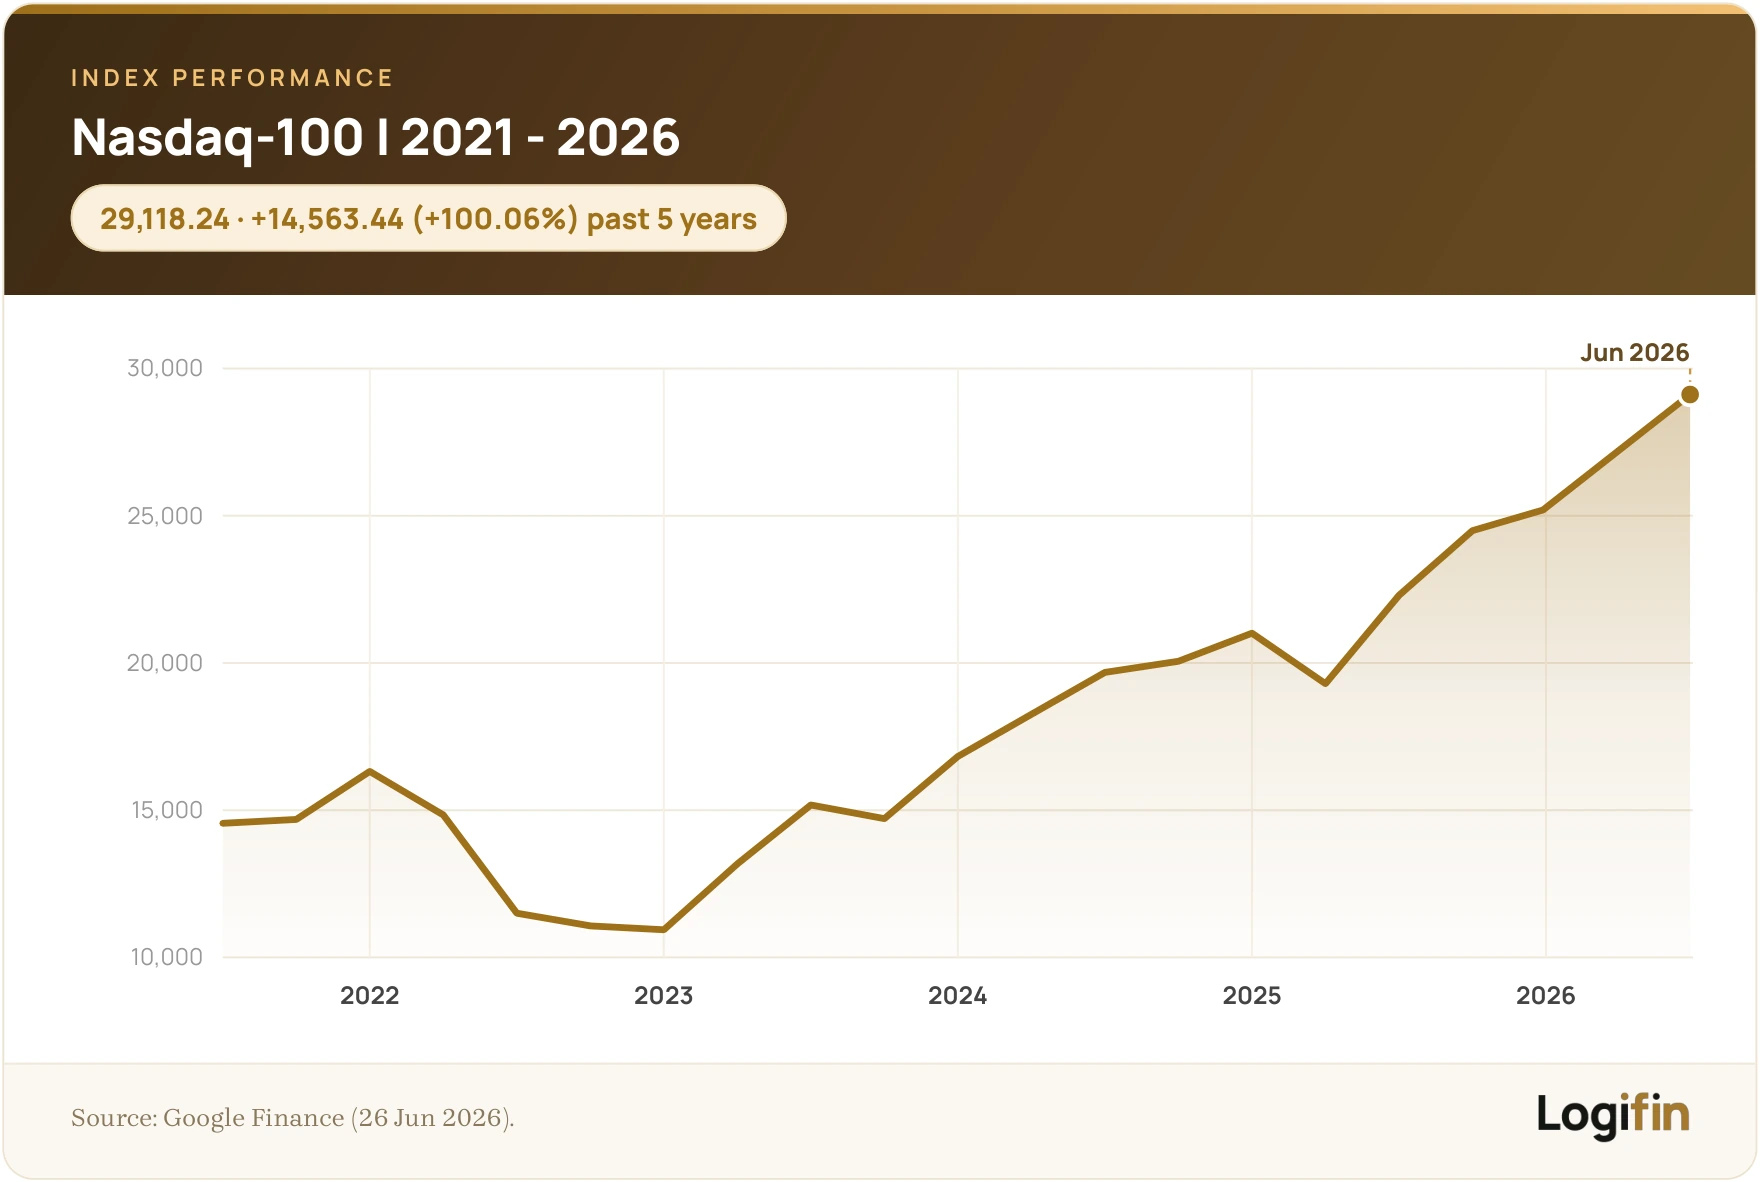
The Nasdaq-100 is an index of growth and expectations.
- It reflects where the economy is heading, not where it was
- It tends to perform better in periods of low interest rates and increased liquidity
- It exhibits greater volatility than the Dow Jones or the S&P 500
It is not a defensive index. It is an index that “bets” on the future.
That is why it is often at the centre of attention for investors seeking long-term growth and exposure to the technologies changing the world.
S&P 500: The most representative index
The S&P 500 (Standard & Poor’s 500) was created in 1957 and is today the most representative index of the U.S. economy.
It includes the 500 largest companies listed on U.S. exchanges and covers approximately 80% of the total market capitalisation of the United States.
For this reason, it is regarded as the “foundation” of both the U.S. and the global market.
🔶 Composition
The S&P 500 covers companies from every sector: technology, energy, healthcare, financials, consumer goods, industrials, communications.
- As of early 2026, the Magnificent 7 (Apple, Microsoft, Amazon, Alphabet, Meta, Tesla, Nvidia) represent approximately 35% of the index’s value, which shows the power of technology in the U.S. economy
- However, thanks to its broad base (500 companies from diverse sectors), it remains more reliable and representative than the Dow Jones or the Nasdaq.
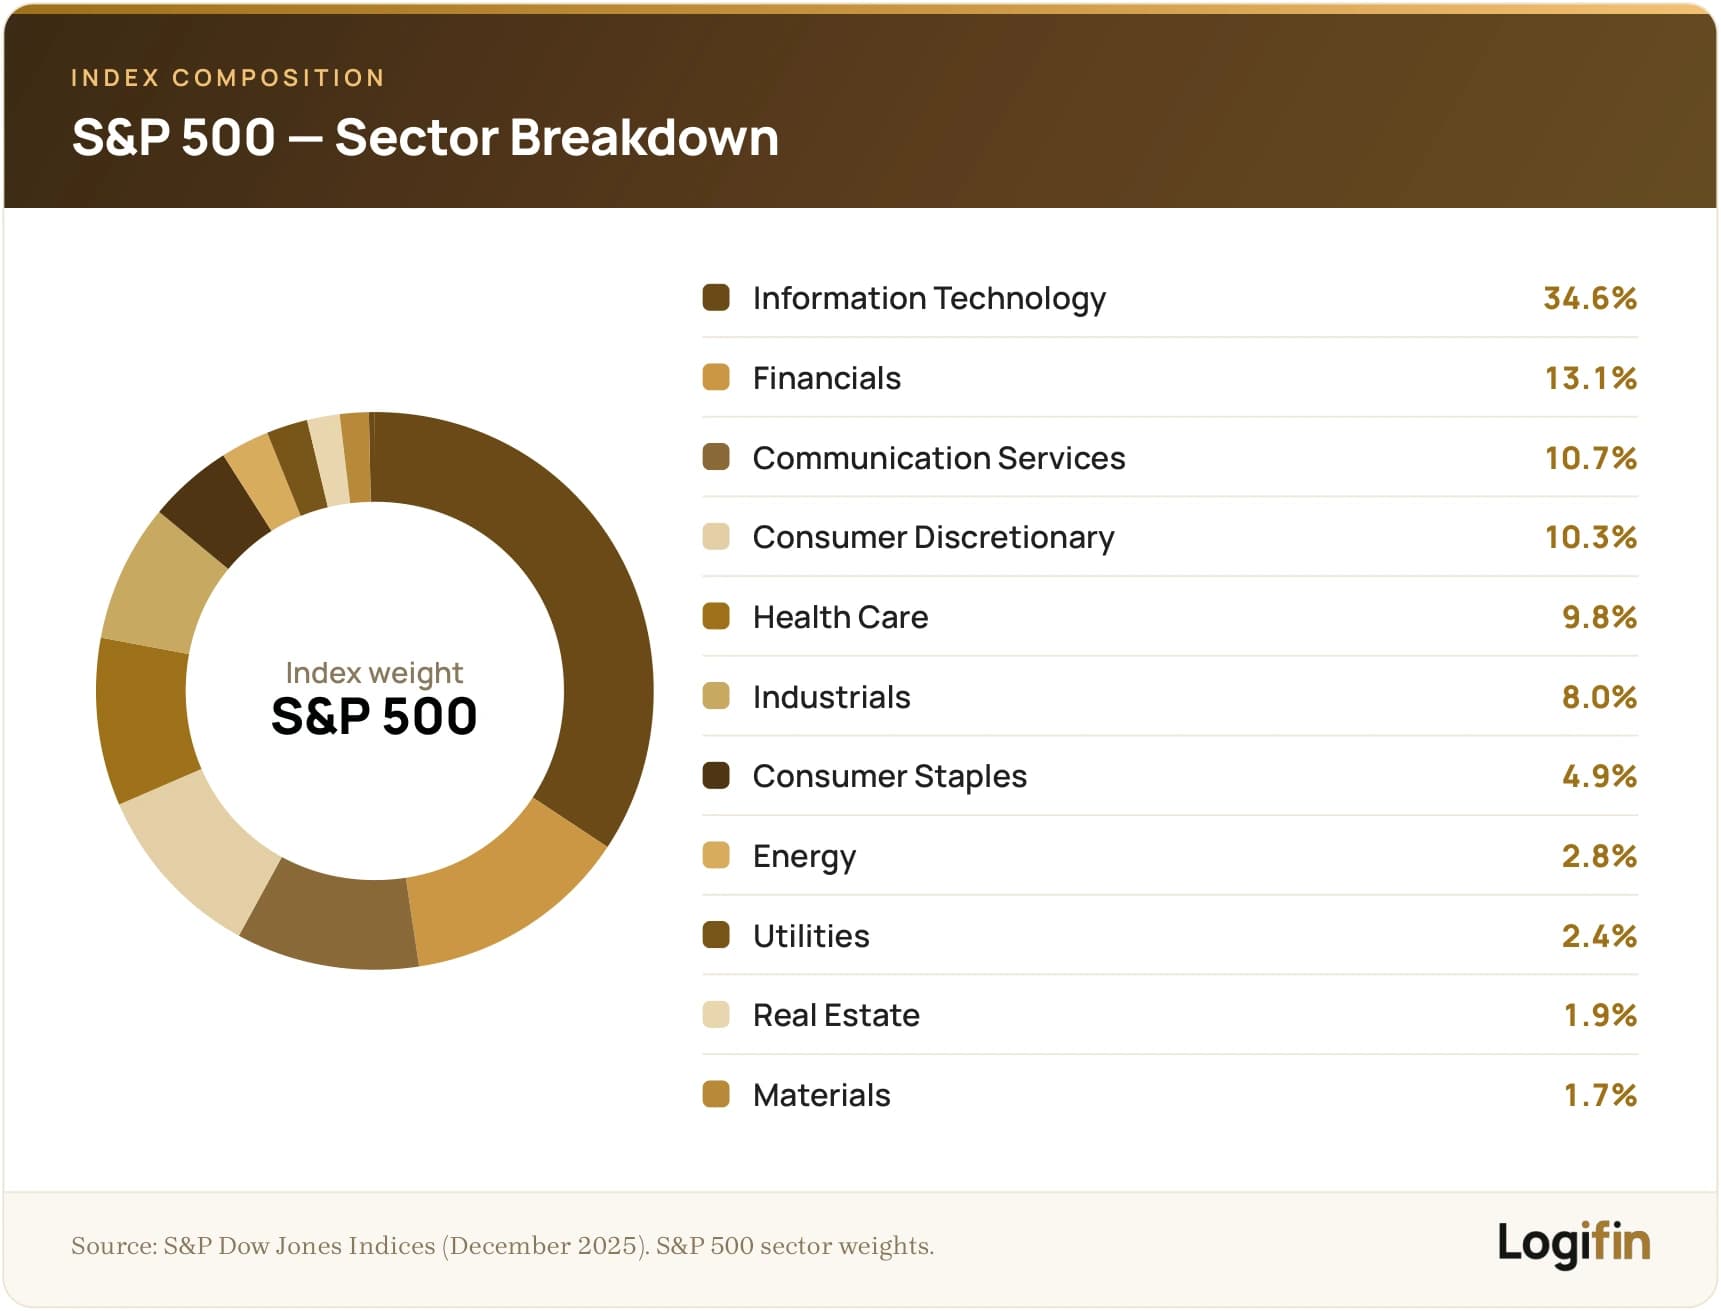
Consequently, when it is said that “the U.S. market rose”, it almost always means that the S&P 500 recorded a gain.
🔶 Weighting
The S&P 500 is a market-cap weighted index.
This means that larger companies have a greater impact on the index’s course than smaller ones.
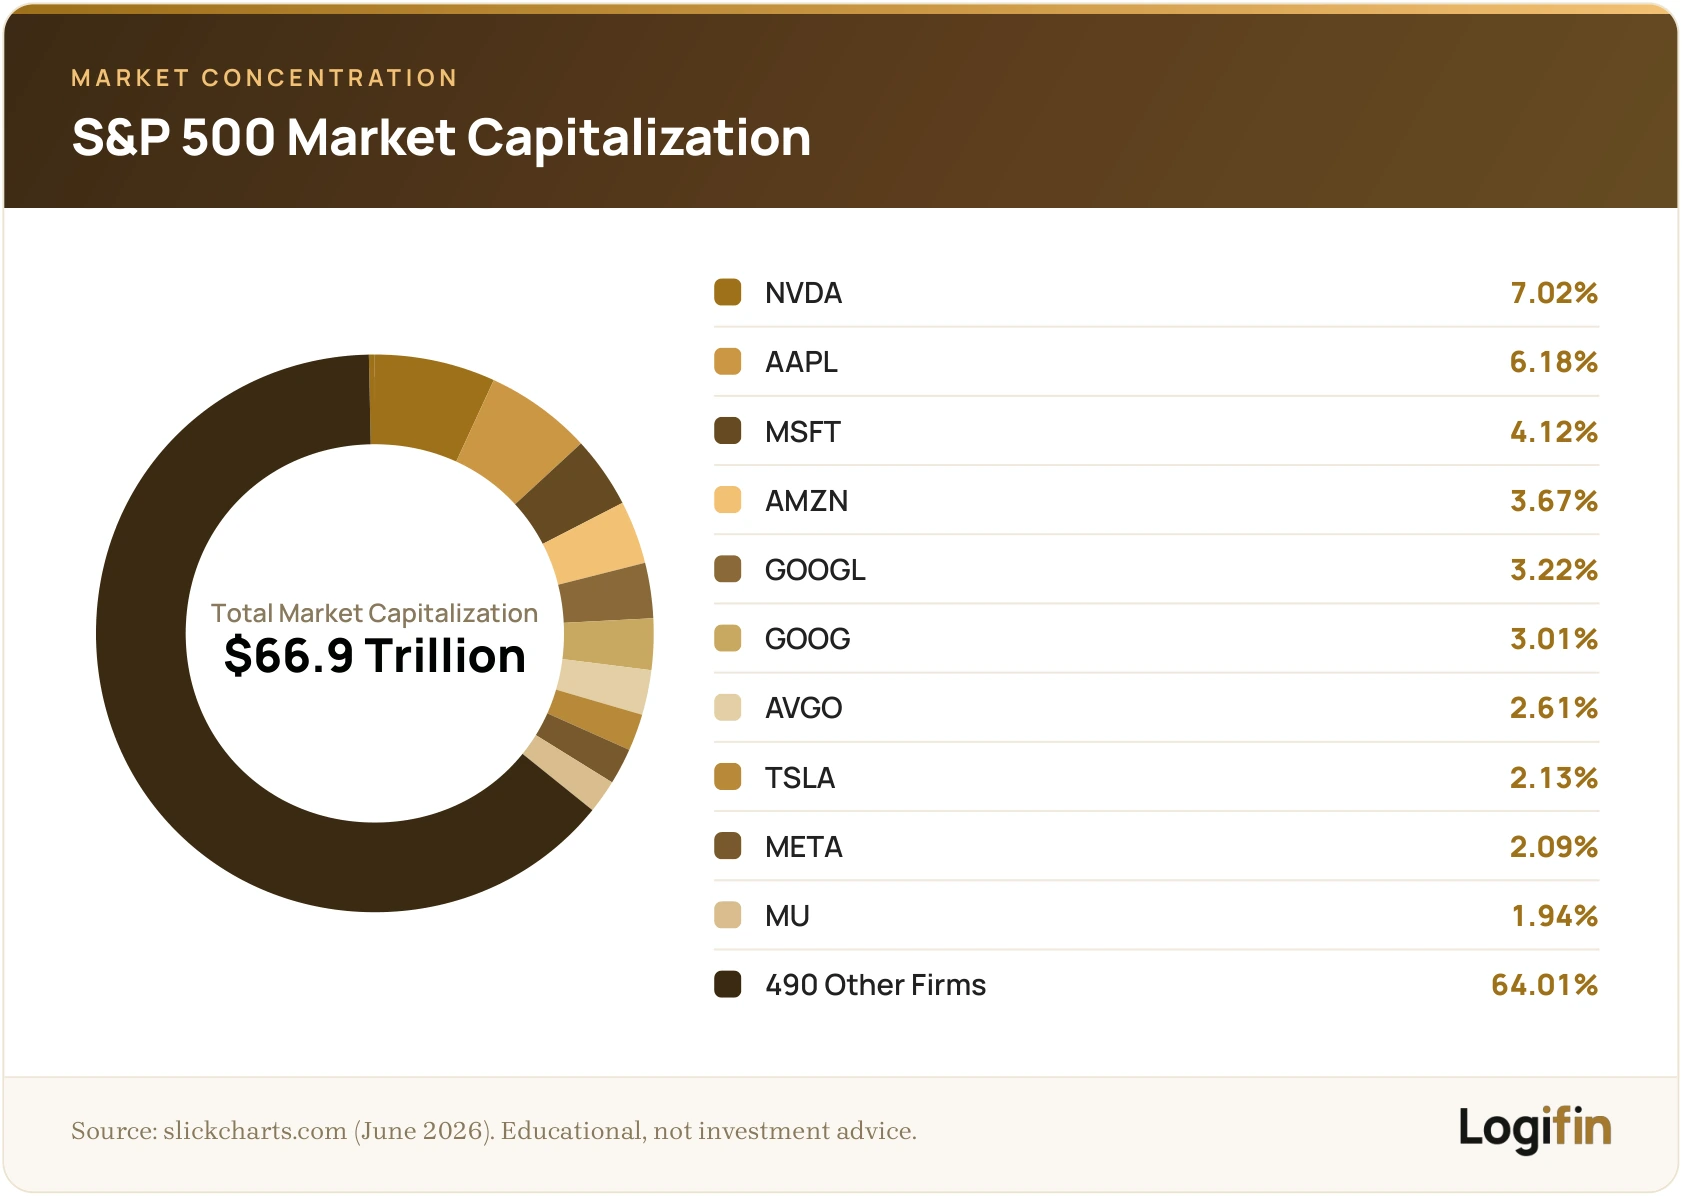
This makes it more realistic than the Dow Jones, which is based only on share price, while at the same time it also reveals the concentration of power in a few giants.
🔶 What It Represents
The S&P 500 is the benchmark not only for the U.S. but also for the global market.
- It is used by most mutual funds and ETFs (e.g. VOO, VUAA) as a key reference point.
- It is considered a proxy for global growth, since most of the 500 companies have international operations and profits coming from all over the world.
- For investors outside the U.S., it is the easiest “window” into the U.S. economy.
For a European investor who wants simple but powerful U.S. exposure, an S&P 500 ETF is often the core “building block” of a portfolio.

According to data from S&P Dow Jones Indices, the S&P 500 has historically recorded an average annual return of about 10% in nominal terms and roughly 6.5%–7% in real terms.
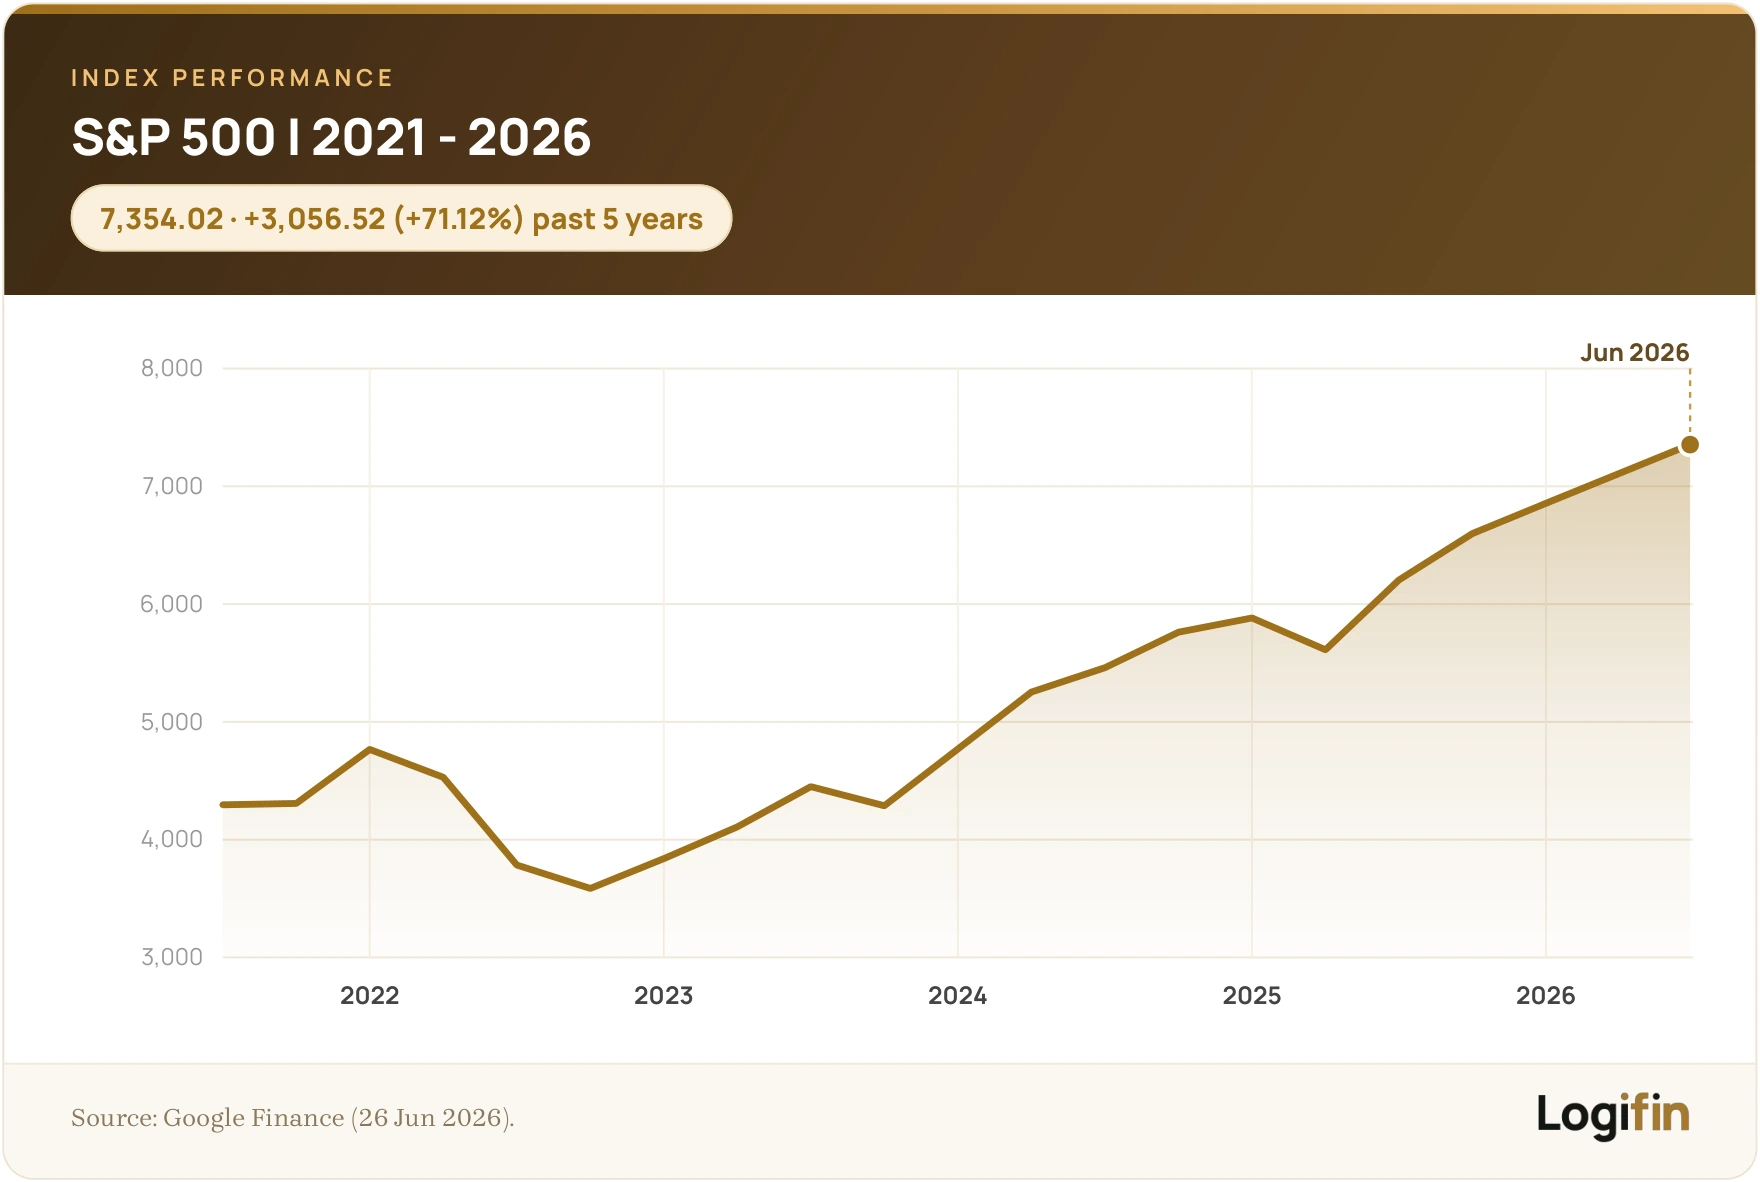
This long-term performance has established it as a key reference point for the U.S. equity market, particularly in analyses concerning investments with a long-term horizon.
The key differences between the Dow Jones, Nasdaq-100 and S&P 500
Although they are often mentioned together, the three major U.S. indices are not the same.
They have different histories, compositions and calculation methods, which affects the way we “read” the market and interpret its movements.
🔶 Dow Jones (DJIA)
- The oldest index, created in 1896 by Charles Dow.
- It includes just 30 large companies (“blue chips”), regarded as the “elite” of the U.S. economy.
- It is calculated by share price (price-weighted), meaning that a high-priced stock disproportionately affects the index.
- It is more symbolic and historic in character than fully representative of the economy.
- It does not capture the entire market, nor the technological momentum to its fullest extent.
🔶 Nasdaq-100
- It has a strong concentration in technology, platforms, semiconductors and modern forms of entrepreneurship
- It includes the 100 largest non-financial companies of the Nasdaq exchange
- It is weighted by market capitalisation, with rules that limit over-concentration.
- It mainly represents growth stocks, which makes it more volatile but also with greater upside potential.
🔶 S&P 500
- The most representative index of the U.S. market. Created in 1957.
- It includes 500 of the largest listed U.S. companies, covering all the main sectors.
- It is weighted by market capitalisation, which makes it a more reliable measure of the overall market.
- It represents approximately 80% of the total value of the U.S. stock market.
- It offers broad diversification, balancing growth and stability
- When people refer to the “average return of U.S. stocks”, they almost always mean the S&P 500, as it is the key benchmark for institutional and retail investors.
🔶 Comparison Table
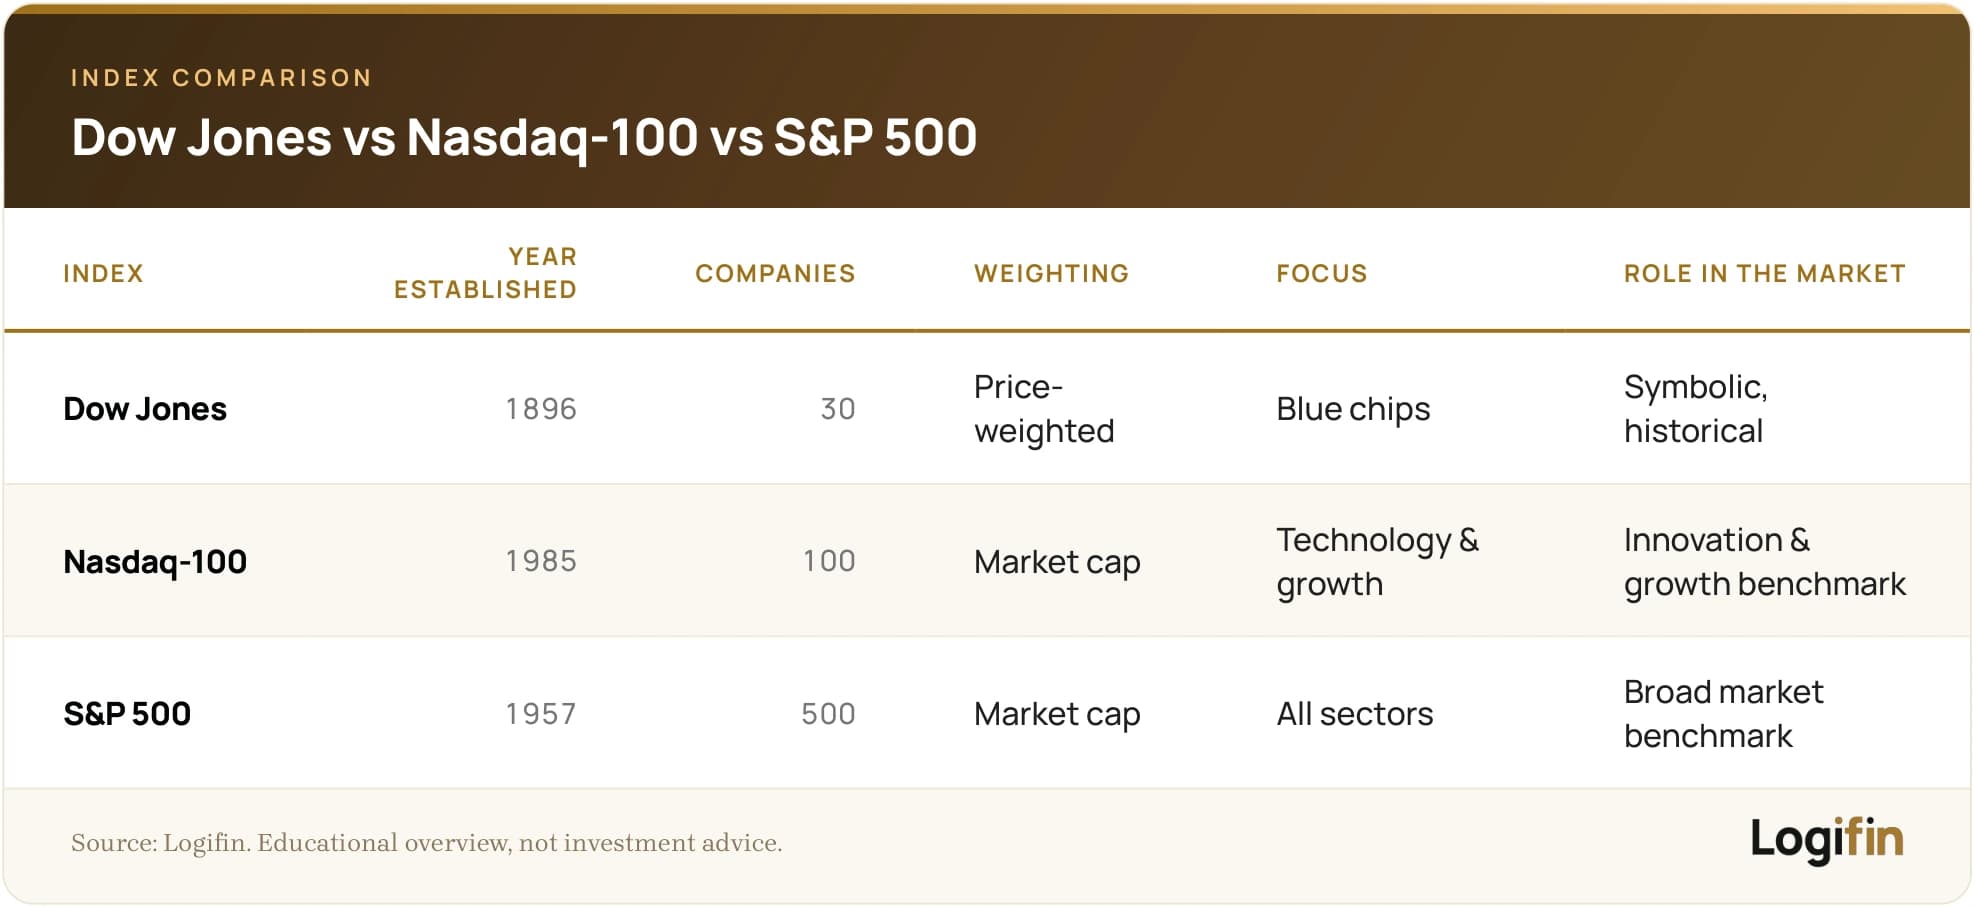
Their differences explain why they often move differently.
On a given day the Nasdaq may sink under pressure on Big Tech, while the Dow stays almost unchanged thanks to support from sectors such as industrials or banks.
The S&P 500, as the broadest and most balanced, usually gives the most reliable picture of the overall market.
Conclusion and practical takeaways
Stock market indices are not merely “numbers on a screen” or news headlines.
They are tools for understanding the market, indicators of direction and reference points for investors around the world.
Each index captures a different part of the economy and a different investment philosophy.
🔑 What to Keep in Mind
- The Dow Jones is more symbolic and less representative of the overall market.
- The Nasdaq-100 gathers growth and technology companies, with higher volatility but also higher potential.
- The S&P 500 is the key benchmark of the U.S. economy and offers broad diversification.
- Their differences are not only in the number of companies but also in the philosophy they represent.
Practical tips for new investors
1. Do not choose an index by performance alone
- High past returns do not guarantee the future.
- An index with sharp swings may not be suitable if you cannot tolerate large temporary losses.
2. Understand what it actually contains
- Investing in the Nasdaq-100 means increased exposure to technology.
- Investing in the S&P 500 means participating in the whole economy.
- The choice should be deliberate and not random.
3. Use indices as “building blocks”
- Many investors combine indices for better balance.
- For example, a broad index such as the S&P 500 together with a more growth-oriented one such as the Nasdaq-100.
4. Think long-term
- Indices are designed for years, not months.
- Patience and consistency matter more than perfect timing.

The content of this article is provided exclusively for informational and educational purposes and does not constitute investment advice or a recommendation to buy or sell financial products. The information is based on publicly available sources considered reliable, without any guarantee of accuracy or completeness. Before making any financial or investment decision, it is recommended that you consult a certified professional advisor or accountant, taking into account your own financial situation and risk profile. The Logifin team bears no responsibility for any direct or indirect damages arising from the application of the information presented.
Related articles

Investing in the S&P 500: Is SXR8 better than VUAA?
We compare SXR8 with VUAA on performance, cost, spread and the EUR/USD exchange rate, so you can see which one fits a monthly DCA plan.
15 min read

The 5 most popular stock market indices – and the ETFs that track them
From the S&P 500 to the MSCI World: Which indices define global markets
22 min read

How do economic indicators affect the stock market?
GDP, inflation, unemployment, interest rates: how economic indicators move the stock market and what investors should watch.
15 min read

What is a recession and how it affects investors?
How a recession is defined, what causes one, how the markets usually behave during it and what an investor can do to prepare in advance.
24 min read
EXPLORE LOGIFIN
Everything you need in order to learn, plan and track your investments.
Logifin Blog
Learn everything you need to get your finances in order and invest with confidence.
Logifin Insights
What moves the markets and what it means for a long term investor. Short and without the noise.
Logifin Tools
Free, inside the site, no signup. Everything you calculate stays on your device.
Logifin ETF Hub
Find the ETF that fits you: 550+ UCITS ETFs, smart filters and in-depth comparisons.
Logifin Guides
A series of guides that builds your investment plan step by step. The first guide is free for everyone.
Logifin Circle
The tools and the Hub are free for everyone. You become a member for the intelligence that never stops.