How do economic indicators affect the stock market?
GDP, inflation, unemployment, interest rates: how economic indicators move the stock market and what investors should watch.
18 August 2025 · 15 min read

What are economic indicators and why do they matter?
Economic indicators are statistics that describe the health and direction of an economy (from GDP and inflation to unemployment and interest rates) and they affect the stock market because they shape investors’ expectations about companies’ future earnings.
They may look like “dry numbers,” but in reality they are like a patient’s monitor: they show whether the economy is breathing properly, whether it is accelerating, or whether it risks slipping into recession.
For the markets, these indicators are decisive. Stock prices are influenced not only by a company’s profitability, but also by the broader economic environment.
If the indicators point to growth, investors tend to expect higher profits and more investment opportunities. If, on the contrary, the indicators point to a slowdown, fear rises and a market decline often follows.
For example, a rise in GDP usually translates into higher consumption and increased revenues for companies. On the other hand, a sudden rise in unemployment can act as a “warning bell” that demand will fall, which puts pressure on stock prices.
🔶 Why do they matter for the investor?
Economic indicators work like the pulse of the economy. They do not predict the future with precision, but they show how the market “sees” it and how expectations are formed.
For an investor who thinks long-term, they are a tool for understanding and not a reason for hasty moves.
- They shape market expectations: Markets move based on what they expect to happen, not only on the present.
- They price in developments before they show up in the data: Prices often change months before economic trends are confirmed.
- They give context, not buy or sell signals: They help you understand where we are in the economic cycle without leading to impulsive moves.
- They capture collective psychology: They show whether the market is fearful, optimistic or preparing for a change of direction.
- They help with strategic adjustment: They allow small, conscious adjustments without sacrificing long-term discipline.
- They support decision-making based on knowledge rather than instinct: An informed investor uses the indicators for understanding, not for prediction.
GDP (gross domestic product)
Gross Domestic Product (GDP) is perhaps the most basic and recognizable indicator of the economy.
Simply put, it captures the total value of all goods and services produced in a country within a specific period of time (usually a quarter or a year).
It represents the “income” of an economy, like a household’s income, but on a massive scale.
🔶 Why do the markets care?
GDP (Gross Domestic Product) is the most direct way to understand whether an economy is growing or shrinking.
For the markets it is not just a number. It is an indicator that affects expectations for profits, investment and employment.
Investors tend to react strongly to changes in GDP, because it is directly linked to the course of companies and of the economy as a whole.
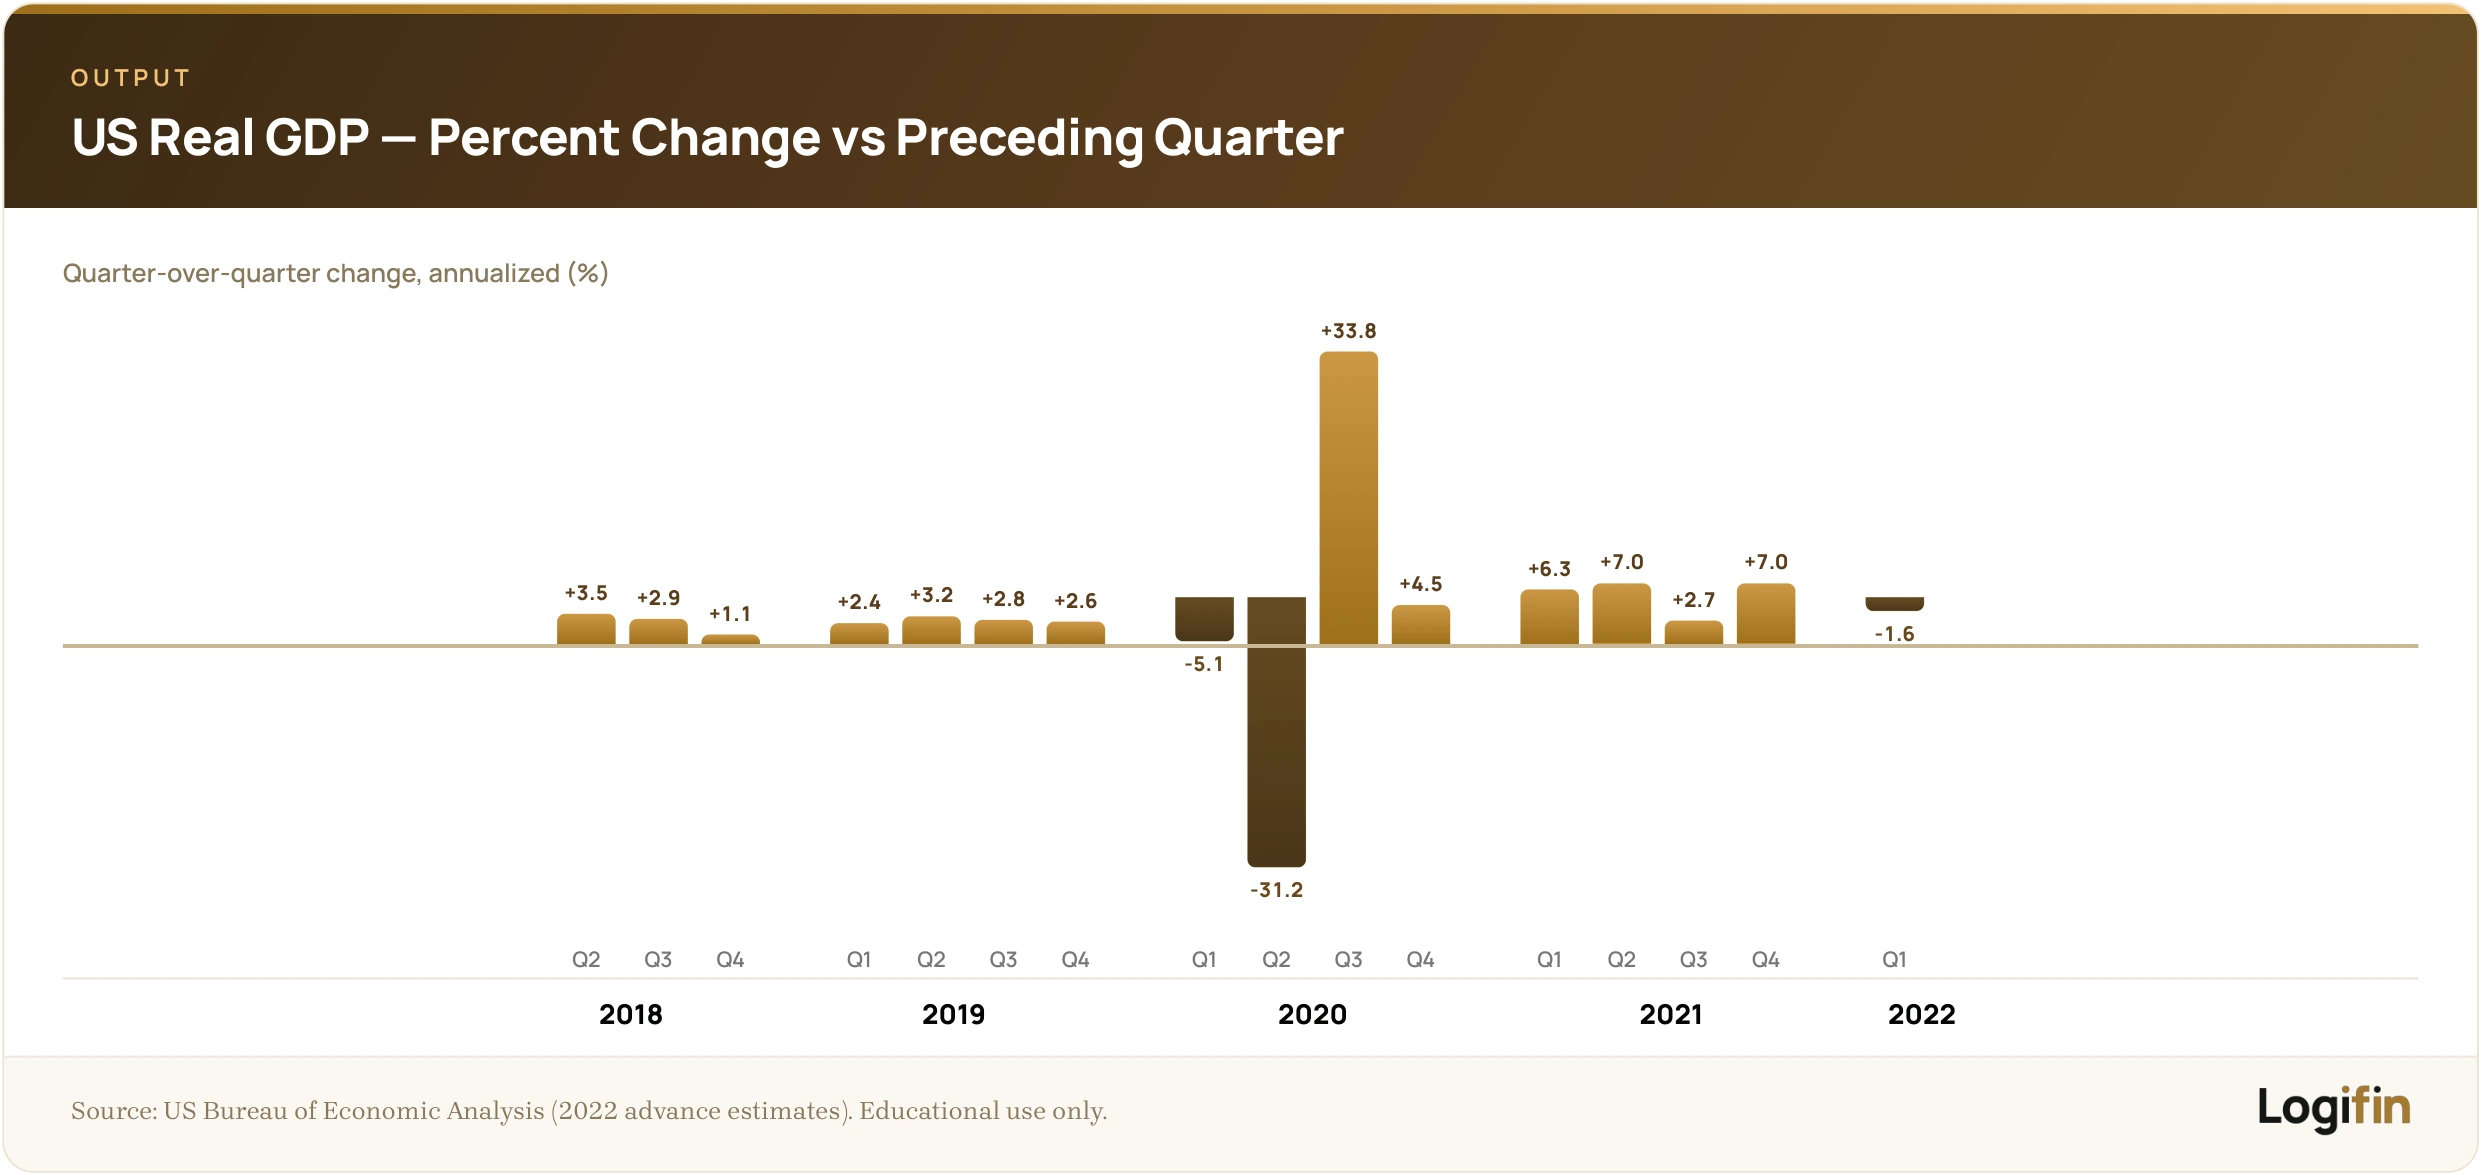
A rise in GDP means economic growth
- Businesses sell more products and services.
- This usually leads to higher profits, better prospects and a greater appetite for investment.
- Markets often reward this picture with a rise in stock prices.
A fall in GDP indicates recession or slowdown
- Lower economic activity means squeezed revenues, reduced investment and increased risk of layoffs.
- In such periods, markets tend to become more cautious or negative.
GDP also affects other policy decisions
- Central banks and governments use GDP data to adjust interest rates, fiscal policy and support measures.
- These decisions have a direct impact on the markets.
🔶 Nominal vs Real GDP
It is important to draw a distinction:
- Nominal GDP: calculated based on current prices. If there is inflation, it may look as if the economy is growing, when in reality prices are simply rising.
- Real GDP: adjusted for inflation, it shows real growth in terms of output. For the markets, real GDP is the more reliable measure.

🔶 The relationship with the stock markets
The relationship between GDP and the stock markets is not linear. Markets do not simply wait for the final data to react.
Instead, they move based on expectations and on how much the actual data deviates from them.
Forecasts matter more than the number itself:
- Investors price in the course of the economy months before the official data is announced.
- When forecasts are already embedded in prices, the final outcome plays a smaller role.
The deviation from expectations is the key:
- If GDP falls less than the market expected, investors may take it as a positive sign.
- In that case the stock markets can move higher, despite the negative reading in the macroeconomic figure.
Markets “look ahead”:
- A temporary fall in GDP can be ignored if investors believe the next quarter or the next year will be better.
- This explains why we often see rallies during periods of economic weakness.
In short, the stock markets do not reflect the present of the economy, but the future as the market imagines it.
That is why understanding expectations is just as important as monitoring the numbers themselves.
Inflation
Inflation is one of the most critical economic indicators, because it directly affects both consumers and the markets.
Simply put, it shows how much the prices of goods and services in an economy are rising.
If the money in your pocket buys less than it did a year ago, then you are experiencing inflation.
🔶 Why is inflation important for the markets?
Investors do not look only at companies’ profits, but also at the environment in which they operate. Inflation directly affects:
- Consumers’ purchasing power: When prices rise, consumers buy less. That means lower sales for businesses.
- The cost of production: Raw materials, energy and wages become more expensive. Companies either absorb this cost (reducing their profits) or pass it on to the consumer (risking lower demand).
- Interest rates: Central banks raise interest rates to curb inflation. But this makes borrowing more expensive for businesses and households, which slows the economy.
🔶 Inflation levels and the markets’ reaction
Inflation works like a “thermometer” of the economy and markets watch it closely, because it directly affects corporate profitability, monetary policy and investor behaviour.
- Mild inflation (~2%): Considered healthy, because it indicates a growing economy. Markets usually welcome it positively.
- High inflation (>5–6%): Reduces corporate profits and raises uncertainty. Stocks are often pressured.
- Hyperinflation: An extreme rise in prices (e.g. Venezuela, Zimbabwe) that destroys confidence in the economy. Markets collapse.
- Deflation (negative inflation): Prices fall. It may look positive for the consumer, but it leads to lower revenues for companies and to recession.
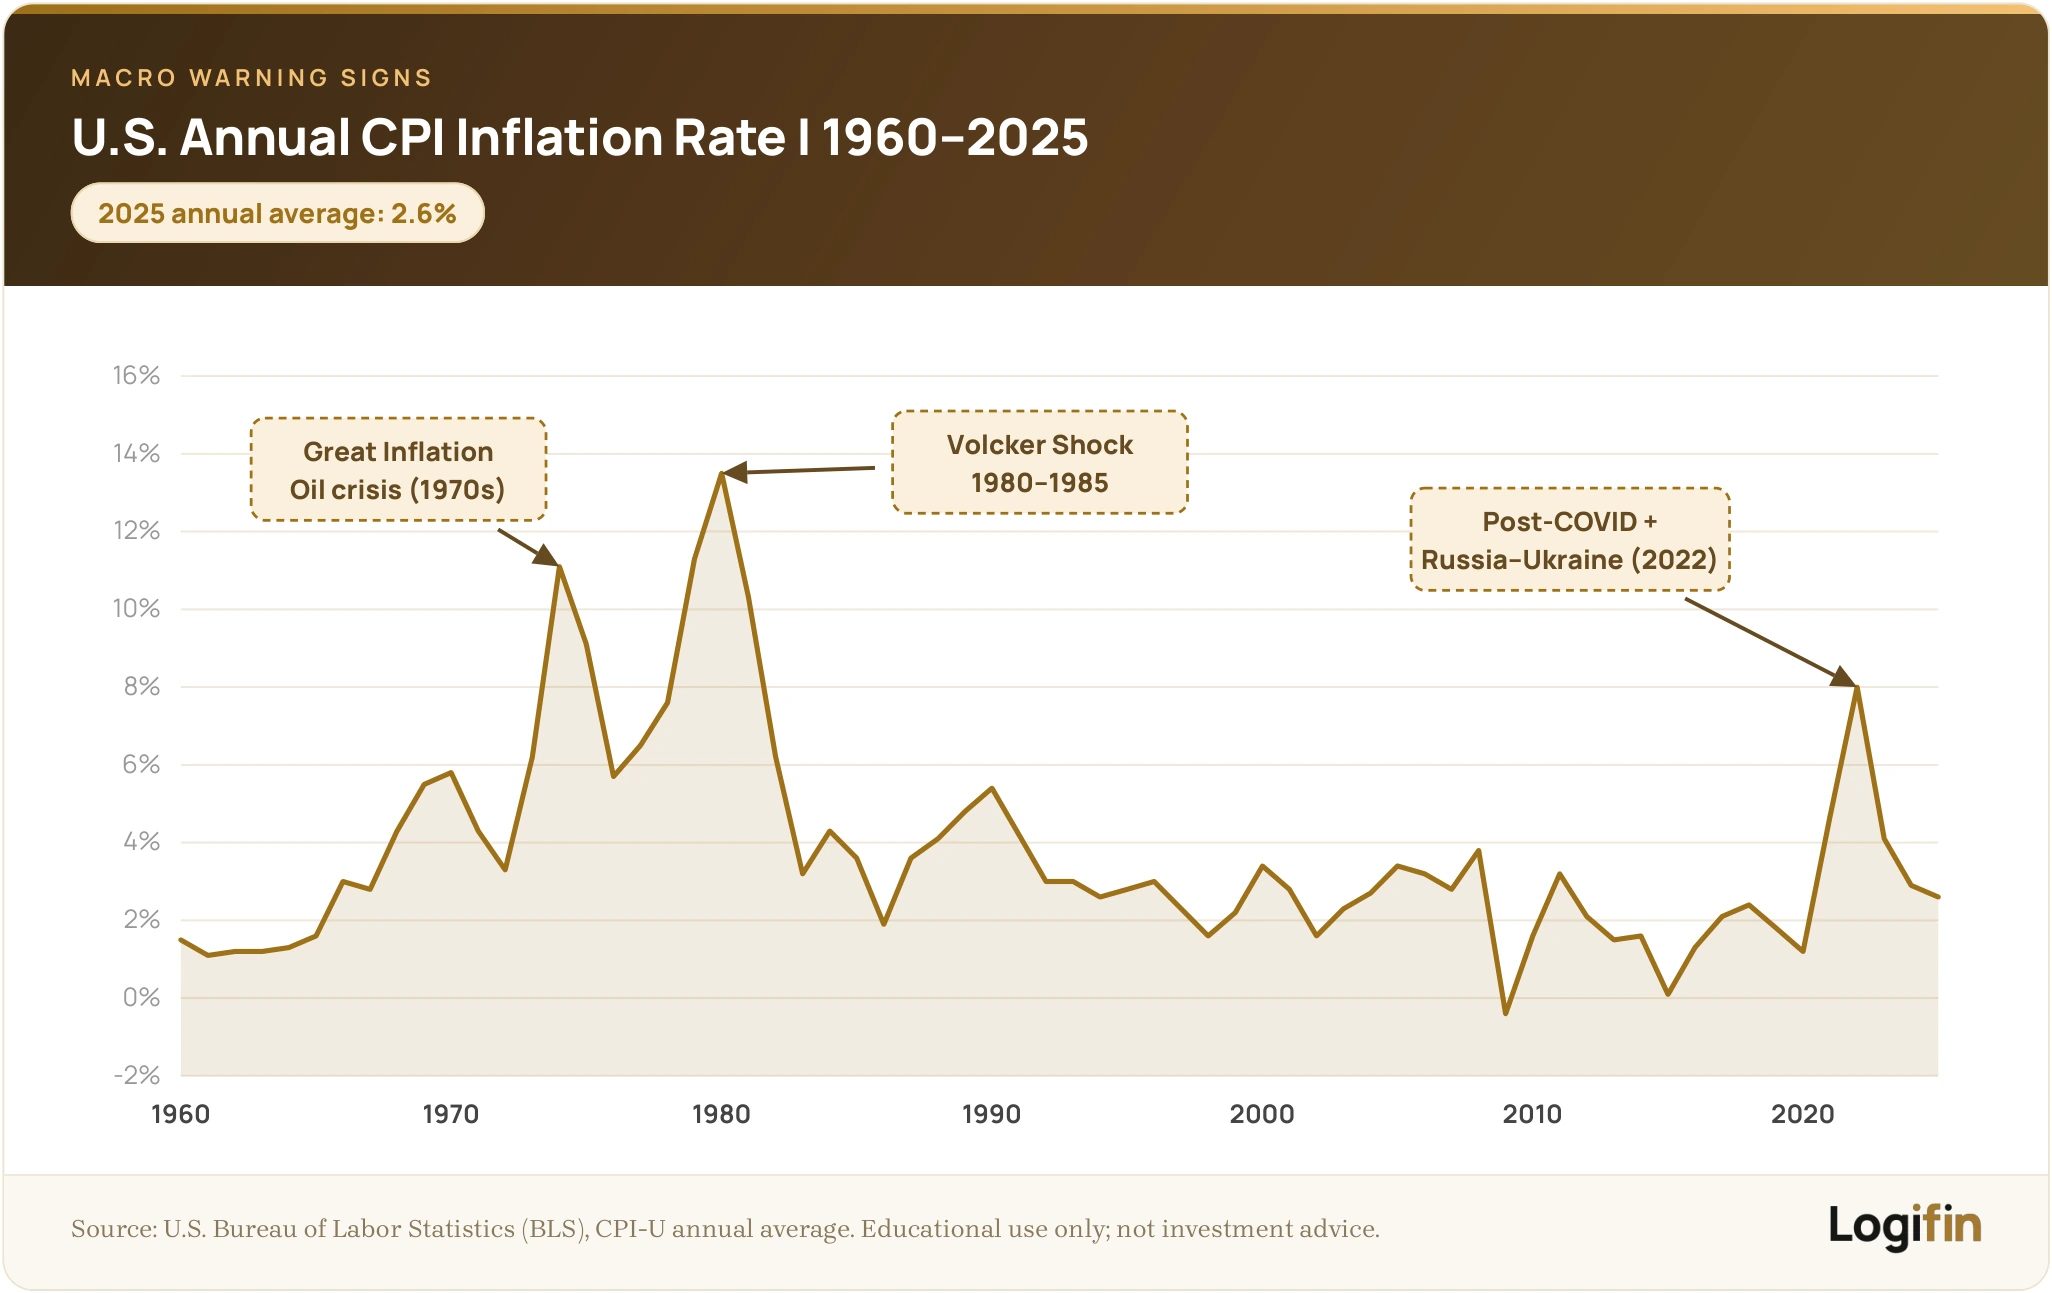
Some examples:
- In the early 1980s, U.S. inflation reached almost 15% (peaking in March 1980). The Fed, under Paul Volcker, drastically raised interest rates to nearly 20% to contain it, causing a temporary recession but ultimately stabilising the economy.
- In 2021–2022, the rise in inflation in Europe and the U.S., driven by the energy crisis and supply-chain disruptions, brought a wave of interest-rate increases, resulting in a fall in bonds and increased volatility in stocks.
🔶 Which assets are hit hardest by inflation?
Fixed-income bonds
- When inflation rises, the real value of fixed coupons declines.
- This means the investor receives money with lower purchasing power, which makes bonds less attractive in periods of high inflation.
Stocks of companies with low profit margins
- Companies that cannot easily pass on increased costs to consumers come under pressure.
- Their profits are compressed and this is often reflected negatively in the share price.
🔶 Which assets often benefit from inflation?
Stocks of commodity and energy companies
- So-called commodity stocks tend to benefit from inflation, as they sell their products at higher prices.
- In many cases their revenues and profits rise in step with inflation.
Real assets such as real estate and infrastructure
- Real assets are often considered a natural hedge against inflation.
- Rents, tolls or infrastructure tariffs can be adjusted upward, preserving the real value of the investment.
Simply put, inflation is not just “bad” or “good” for investments. It is a factor that shifts the balance and calls for a conscious choice of assets.
A portfolio that takes inflation into account is more resilient and better prepared for different economic environments.
Unemployment
The unemployment rate measures the share of the labour force that is looking for work but cannot find it.
It is one of the most sensitive and immediately felt economic indicators, as it affects both citizens’ daily lives and the dynamics of the markets.
🔶 Why does it matter for the stock market?
Unemployment reflects the “heart” of the economy: consumption.
Workers are the most fundamental part of demand. If they are employed and paid, they consume more; if not, they cut their spending, which reduces businesses’ revenues.
- Low unemployment: Indicates a strong economy, stronger consumption and optimism in the market. It is often accompanied by positive returns in retail, services and banking stocks.
- Excessively low unemployment: May push wages upward, increasing businesses’ operating costs. This in turn often leads to inflationary pressures.
- High unemployment: Signals an economic slowdown, falling consumption and a possible recession. Markets usually price this in with declines in cyclical sectors (e.g. automotive, travel).
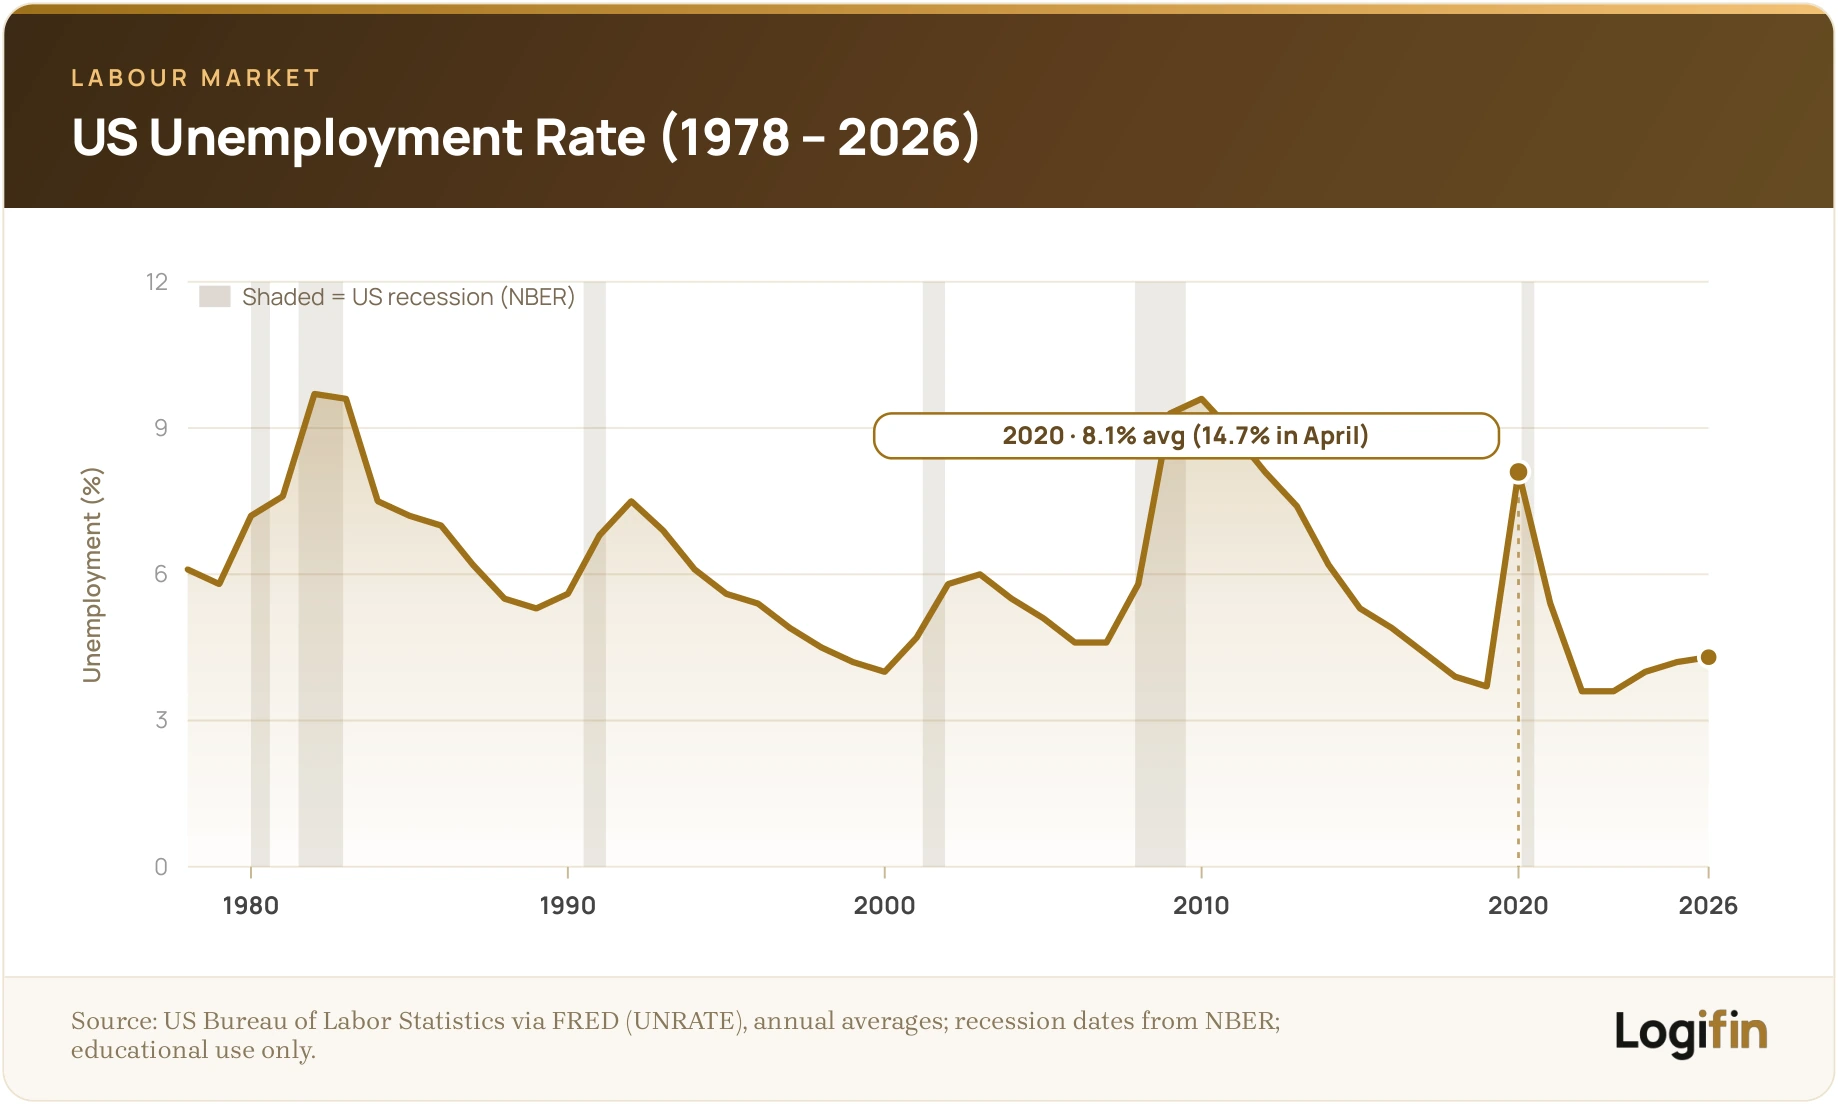
Some examples:
- In the U.S., the monthly jobs report (Non-Farm Payrolls) is one of the most closely watched events on Wall Street. A number better than estimates can send the S&P 500 higher, while a worse-than-expected one can trigger a decline.
- In Europe, unemployment in the southern countries after the debt crisis (2010–2013) exceeded 20%. This heavily pressured European markets, with banks and consumer companies recording large losses.
🔶 Market psychology
Unemployment is not just a number; it affects investor psychology.
- A high unemployment rate means lower consumer spending, increased uncertainty and greater fear of an economic slowdown. In this environment, investors usually move away from stocks that depend heavily on consumption, such as retail, travel and luxury goods.
- Conversely, interest grows in more defensive sectors, such as food, energy and healthcare. Companies in these sectors are considered more resilient, because they offer goods and services that are consumed regardless of the economic cycle.
Interest rates
Interest rates are perhaps the most powerful lever central banks have to influence the economy and, by extension, the stock market.
Essentially, they represent the “cost of money”: how much it costs to borrow or how much it pays to save.
🔶 Why do interest rates matter so much?
Their changes directly affect:
- Businesses: Low rates mean cheap borrowing for investment, growth and expansion. High rates increase financing costs, reduce profit margins and limit new investment.
- Consumers: When loan rates (mortgages, consumer loans, credit cards) are low, people consume and borrow more. When they rise, their purchasing power declines.
- Investments: Investors always compare a stock’s expected return with the “safe” rate they can get from bonds or deposits. The higher rates go, the less attractive stocks appear.
🔶 The relationship with the stock market
Interest rates are one of the most powerful levers affecting the stock market, as they determine the cost of money, liquidity in the economy and the alternative returns available to investors.
Low interest rates:
- They tend to push markets higher, as they boost liquidity and make borrowing easier.
- This explains why in the period after 2008 (post-crisis) markets entered a multi-year uptrend: central banks had cut interest rates almost to zero.
High interest rates:
- They often lead to falling stocks, because consumption decreases and costs rise.
- However, other investment categories benefit, such as short-duration bonds or bank stocks (which gain from higher lending margins).
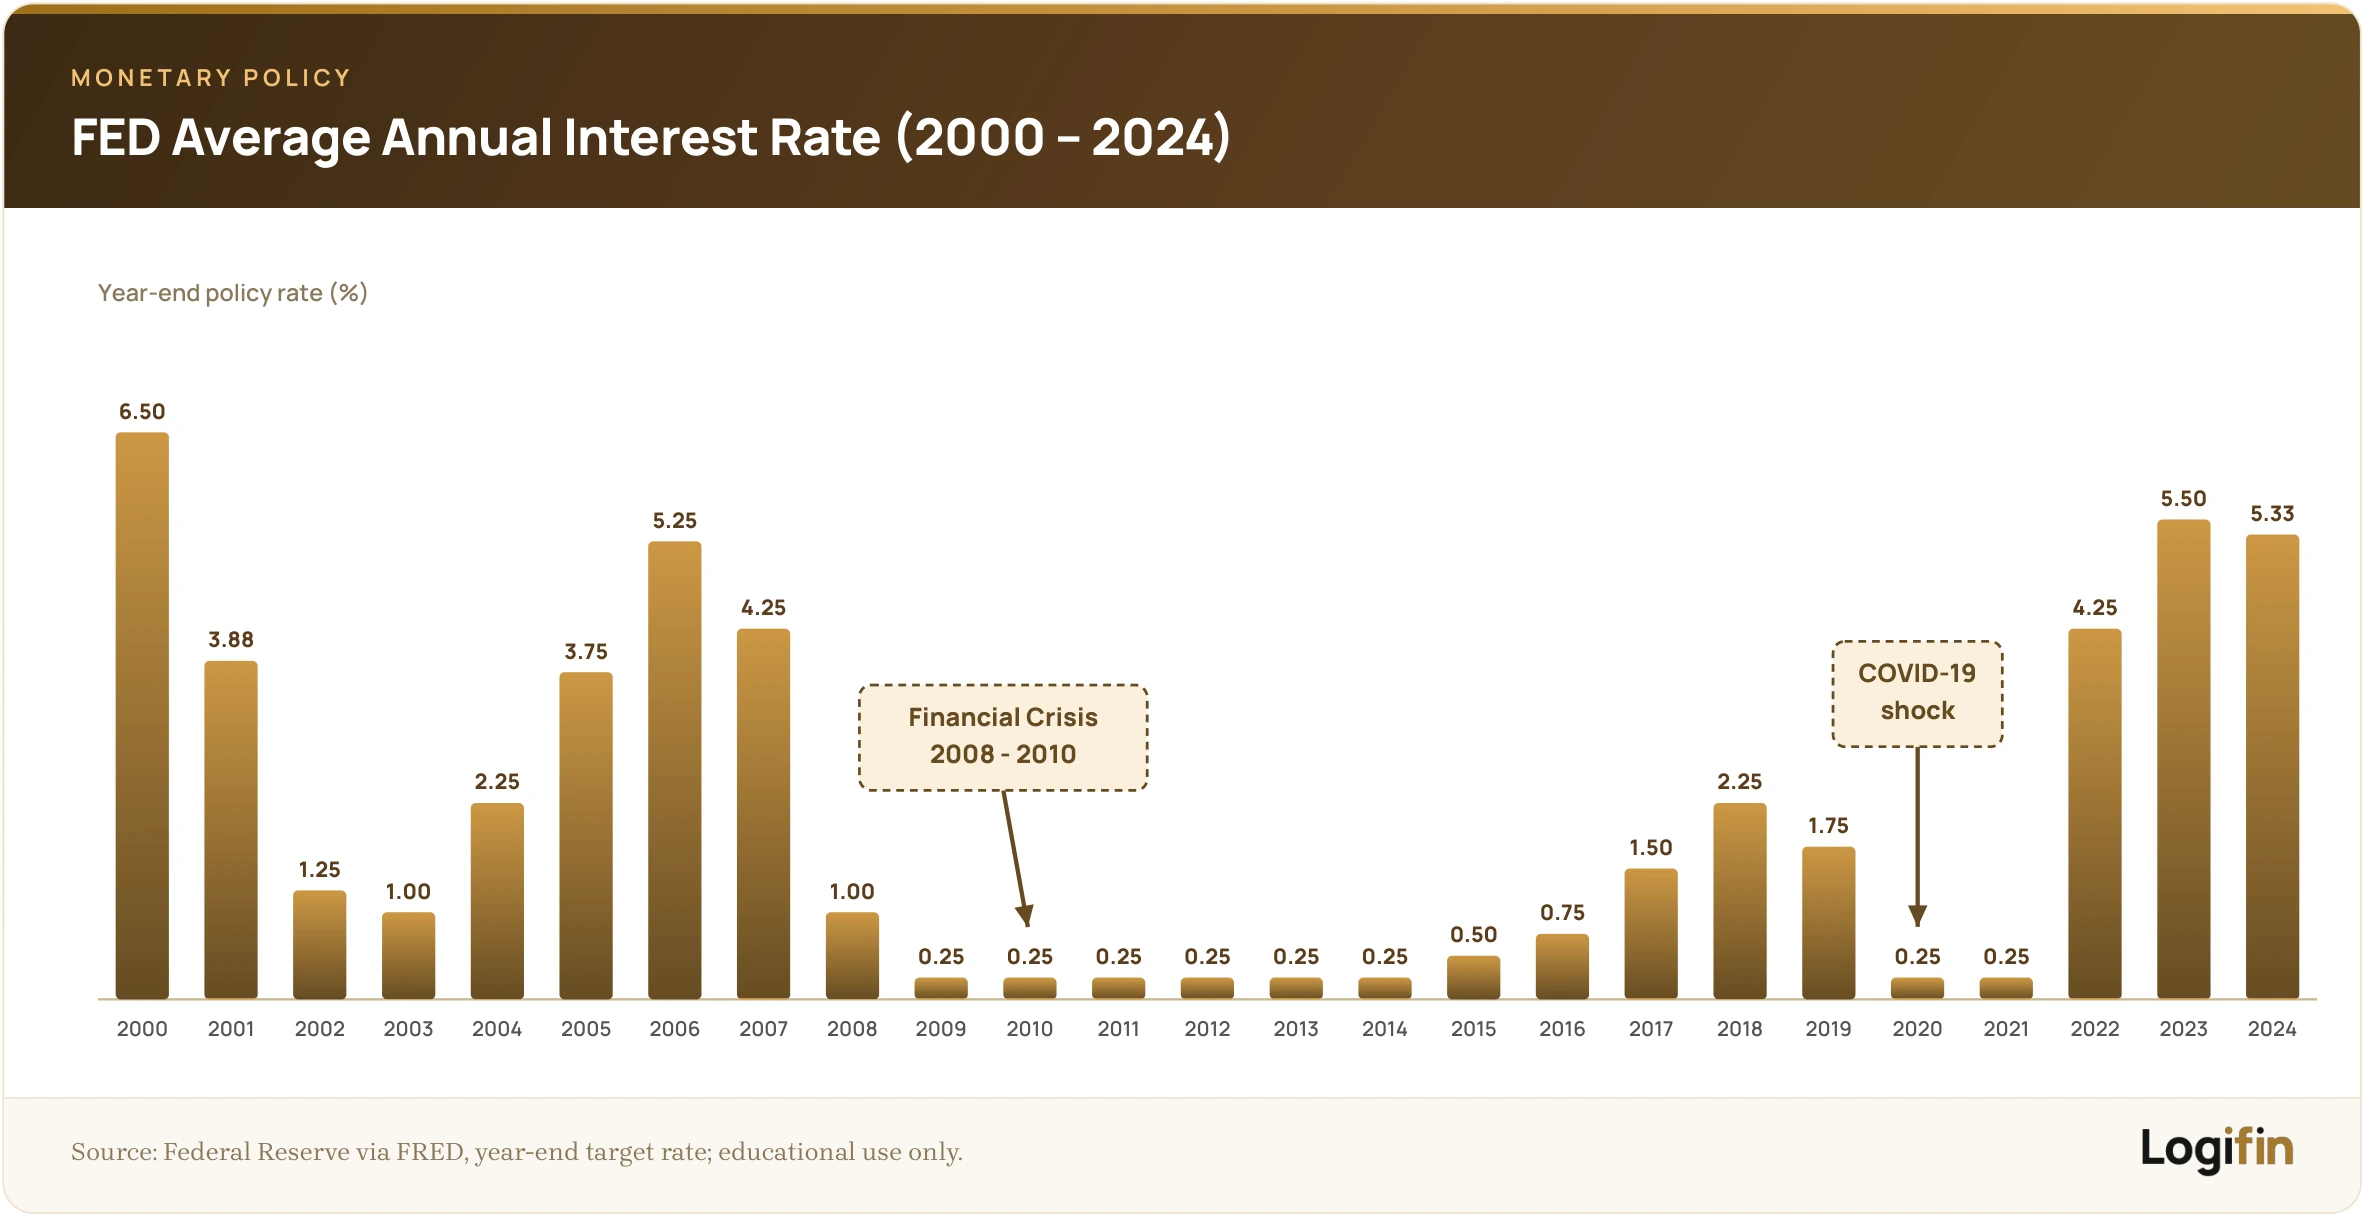
Some examples:
- In 2022–2023 the Fed and the ECB carried out the most aggressive interest-rate increases in the last 40 years to curb inflation. This resulted in large losses in bond markets and increased volatility in technology stocks, which are more sensitive to financing costs.
- In Japan, by contrast, the policy of extremely low interest rates for decades has led to a stable but anemic stock market, with investors chasing returns abroad.
🔶 What the investor should watch
- Growth stocks, such as technology companies, are far more sensitive to interest-rate increases.
- Defensive sectors (e.g. energy, healthcare, food) hold up better in periods of higher interest rates.
- Interest rates affect not only consumption but also market psychology. Even a small increase, if it has not been priced in, can bring large moves in the indices.
Consumer confidence & industrial production indicators
Beyond the “big” indicators such as GDP, inflation and interest rates, there are also more specialised indicators that act as early alarms for the course of the economy.
Two of the most important are Consumer Confidence and Industrial Production.
🔶 Consumer Confidence
The consumer confidence index captures how optimistic or pessimistic consumers feel about the economy.
It is based on opinion surveys about employment, income and the intention to consume or save.
- High confidence: Consumers spend more, businesses see rising revenues and markets tend to climb.
- Low confidence: People cut spending, increase saving and companies see reduced demand. This often leads to falling stocks.
Markets watch these indicators closely because they affect sectors that depend directly on consumption (retail, automotive, travel).
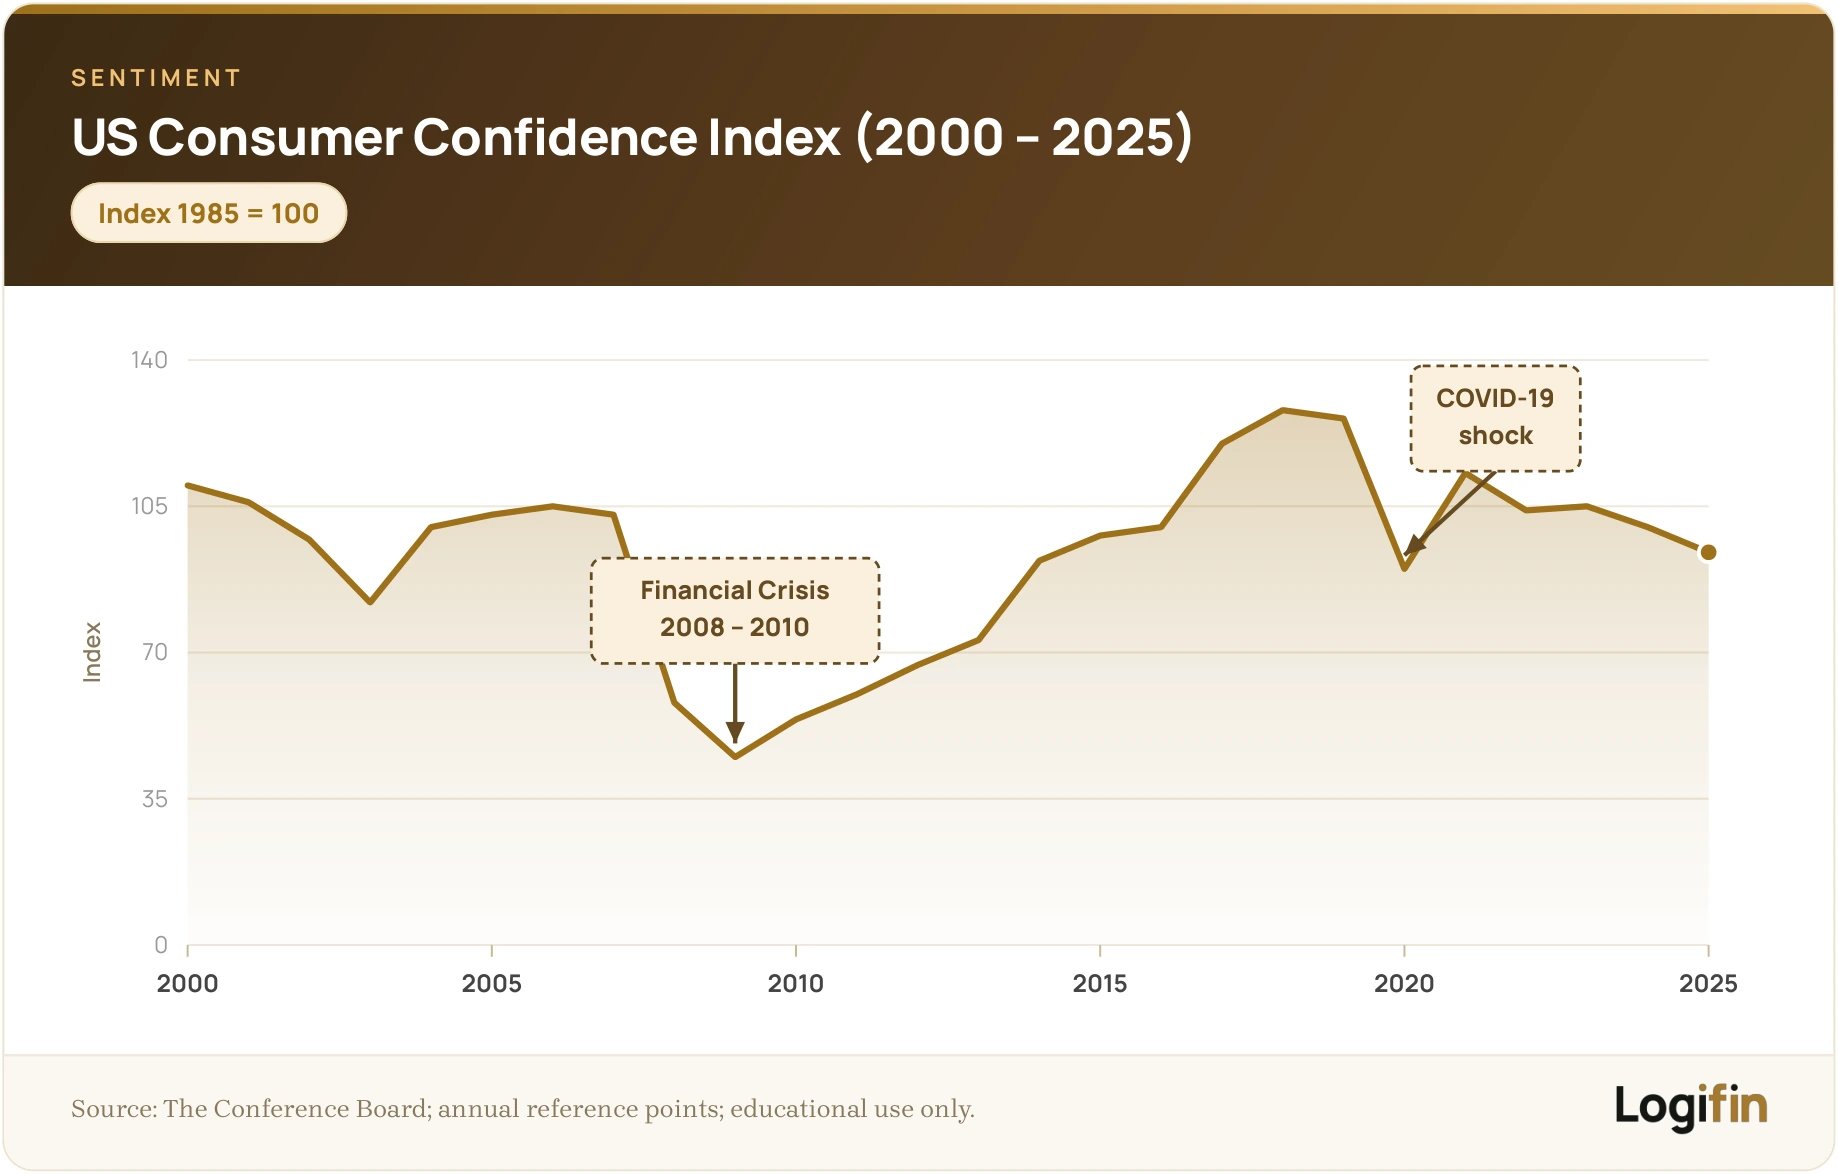
Example:
- In 2008, before the financial crisis even peaked, consumer confidence indices collapsed.
- They were among the first “signals” that the markets would enter a deep decline.
🔶 Industrial Production
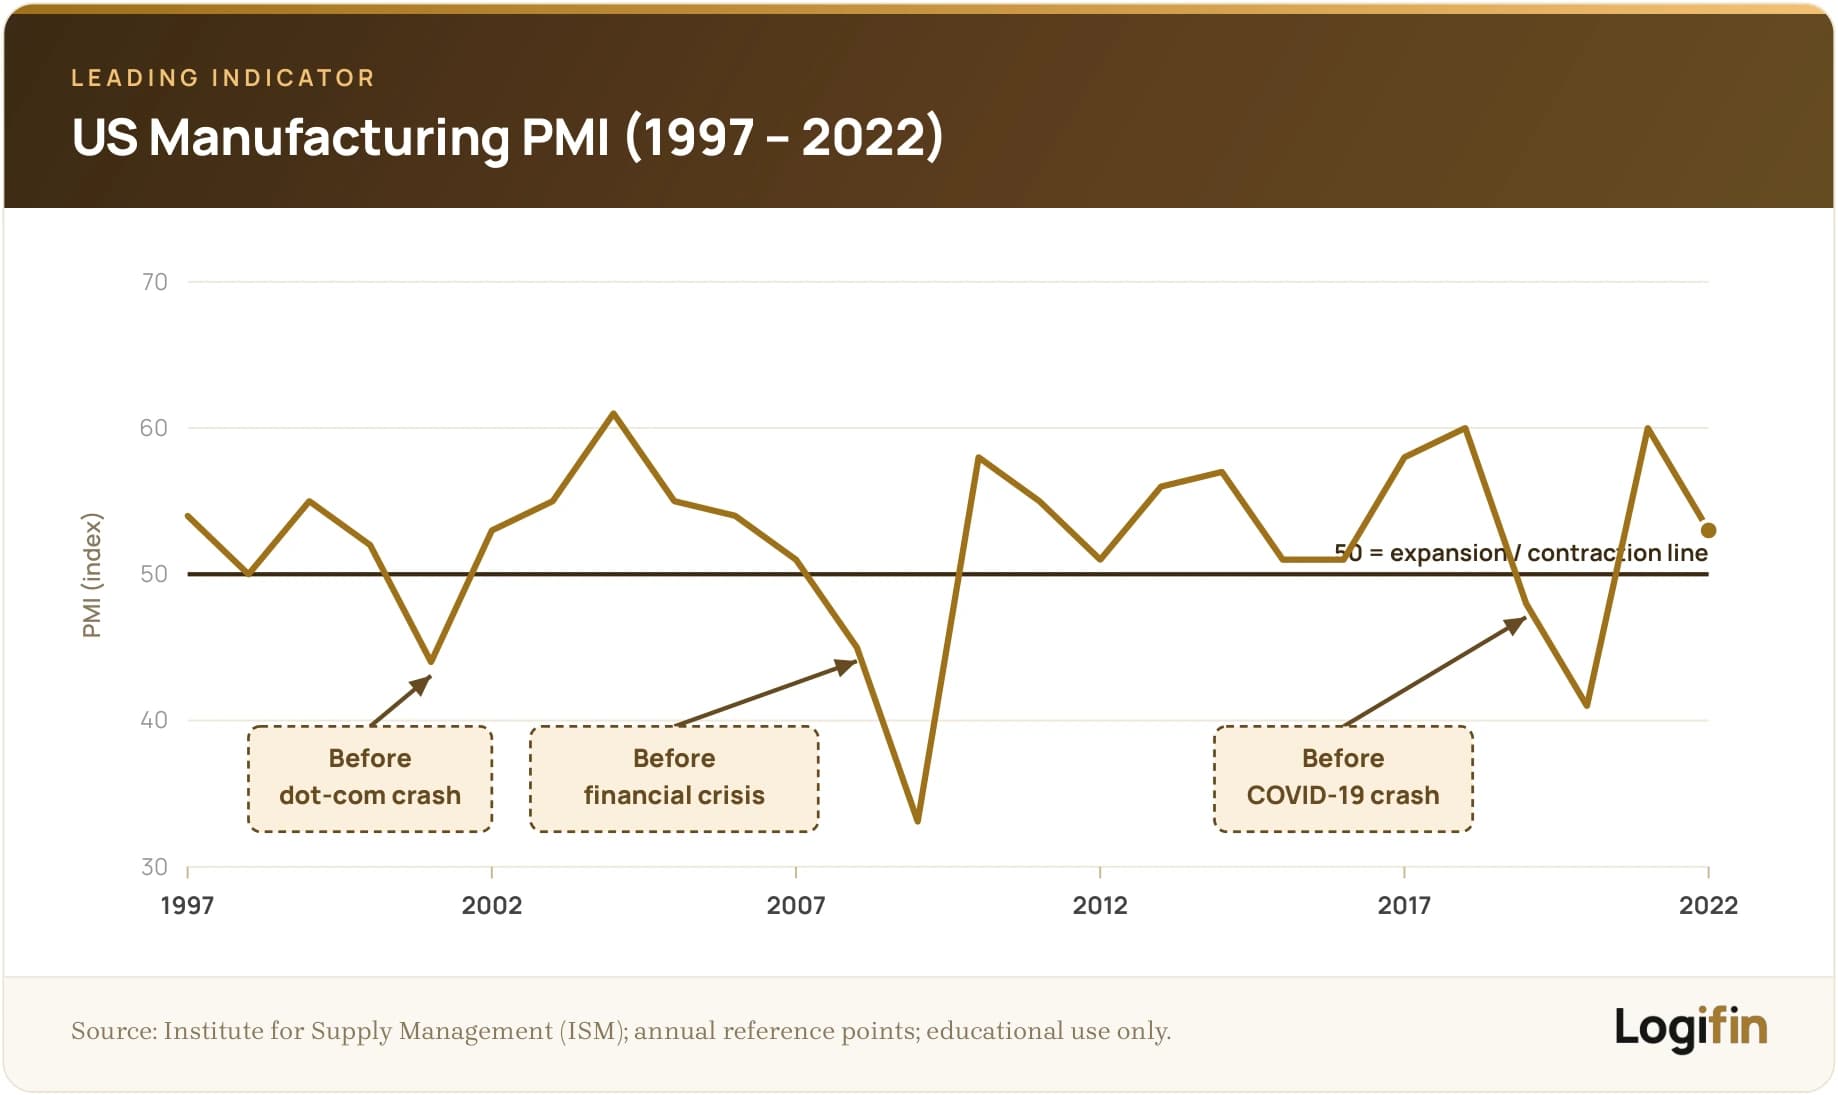
The industrial production index measures the output of factories, mines and utilities.
It is an indicator of the “real” economy, because it shows whether there is demand at the production level.
Rising industrial production:
- It means businesses are increasing their output, which suggests strong demand.
- It is associated with positive prospects for sectors such as industry, exports and raw materials.
Falling industrial production:
- It indicates shrinking demand, a possible decline in profits and recession on the horizon.
- Investors become more cautious.
🔶 The relationship with the markets
Although these indicators do not carry the weight of GDP or interest rates, they are extremely useful for predicting short-term market moves.
A surprising number (positive or negative) can cause strong volatility, especially in sectors directly linked to consumption and industry.
Example:
- In 2015, as China announced weaker industrial production data and a broader slowdown in economic activity, international markets reacted with a sharp correction.
- Concerns intensified after the devaluation of the yuan, as investors feared that China’s slowdown would affect global growth.
Conclusion and practical takeaways
Economic indicators may at first look like cold numbers, but in reality they are the “signposts” that help the investor understand where the economy is heading and, consequently, where the stock market may move.
What matters is not only what is announced, but how the indicators are interpreted in combination with expectations.
🔶 What does this mean in practice?
- GDP: Shows whether the economy is growing or entering recession. It shapes not only the present but also investors’ strategies for the future.
- Inflation: Directly affects consumption and businesses. It is the indicator that most guides central banks’ decisions.
- Unemployment: Linked to the strength of demand in the economy. Small changes are enough to affect market psychology.
- Interest rates: They are the “fuel” or the “brake” of the economy. A single central-bank decision can determine the short-term direction of the markets.
- Confidence & production indicators: They offer earlier signals about what is coming, acting like a “weather forecast” for the markets.
Economic indicators are the language through which the markets “read” the economy.
You cannot predict the future with precision, but you can understand the environment in which you make decisions.
And that is often the difference between the investor who panics and the one who builds wealth methodically and with composure.
🔶 What to do as an investor
- Monitor the indicators regularly, especially the announcements considered market movers (GDP, CPI, unemployment, central-bank decisions).
- Do not react impulsively to every announcement, but examine the trends.
- Remember that indicators give “direction” to the markets, not absolute certainty.

The content of this article is provided exclusively for informational and educational purposes and does not constitute investment advice or a recommendation to buy or sell financial products. The information is based on publicly available sources considered reliable, without any guarantee of accuracy or completeness. Before making any financial or investment decision, it is recommended that you consult a certified professional advisor or accountant, taking into account your own financial situation and risk profile. The Logifin team bears no responsibility for any direct or indirect damages arising from the application of the information presented.
Related articles

What is inflation and how does it affect your investments?
The “invisible tax” that reduces purchasing power and changes the rules of the game for investors
16 min read

What is the Fed and what is its role?
The world’s most powerful central bank and why its decisions affect every investor
15 min read

What is the ECB and how does it affect the economy and the markets?
The role of the European Central Bank in our everyday lives and investments
15 min read

What is a recession and how it affects investors?
How a recession is defined, what causes one, how the markets usually behave during it and what an investor can do to prepare in advance.
24 min read
EXPLORE LOGIFIN
Everything you need in order to learn, plan and track your investments.
Logifin Blog
Learn everything you need to get your finances in order and invest with confidence.
Logifin Insights
What moves the markets and what it means for a long term investor. Short and without the noise.
Logifin Tools
Free, inside the site, no signup. Everything you calculate stays on your device.
Logifin ETF Hub
Find the ETF that fits you: 550+ UCITS ETFs, smart filters and in-depth comparisons.
Logifin Guides
A series of guides that builds your investment plan step by step. The first guide is free for everyone.
Logifin Circle
The tools and the Hub are free for everyone. You become a member for the intelligence that never stops.