What are the signs before a bear market?
How to read the macroeconomic indicators, the market behaviour and the investor psychology that often appear before a fall of more than 20%.
7 September 2025 · 19 min read

What a bear market is and why it matters to understand it
The term bear market describes a period when the prices of stocks (or other assets) fall more than 20% from their recent high and that decline lasts for months or even years.
It is not a simple 5–10% correction, but a prolonged downtrend that is usually accompanied by pessimism, fear and reduced investor confidence.
🔶 Why it is called a "Bear Market"
The name "bear market" comes from the way a bear attacks: it strikes with its claws downward, just as prices fall in the markets during periods of decline.
By contrast, the "bull market" took its name from the bull that lifts its horns upward, symbolising the rise of the markets.
In this way, the two terms became established in financial terminology as images of the two opposite phases of the market.
🔶 Historical Examples of Bear Markets
- Dot-com crash (2000–2002): The Nasdaq Composite lost about 78% of its value from its peak (March 2000) to its low (October 2002). It took more than 15 years (until 2015) to return to the same levels.
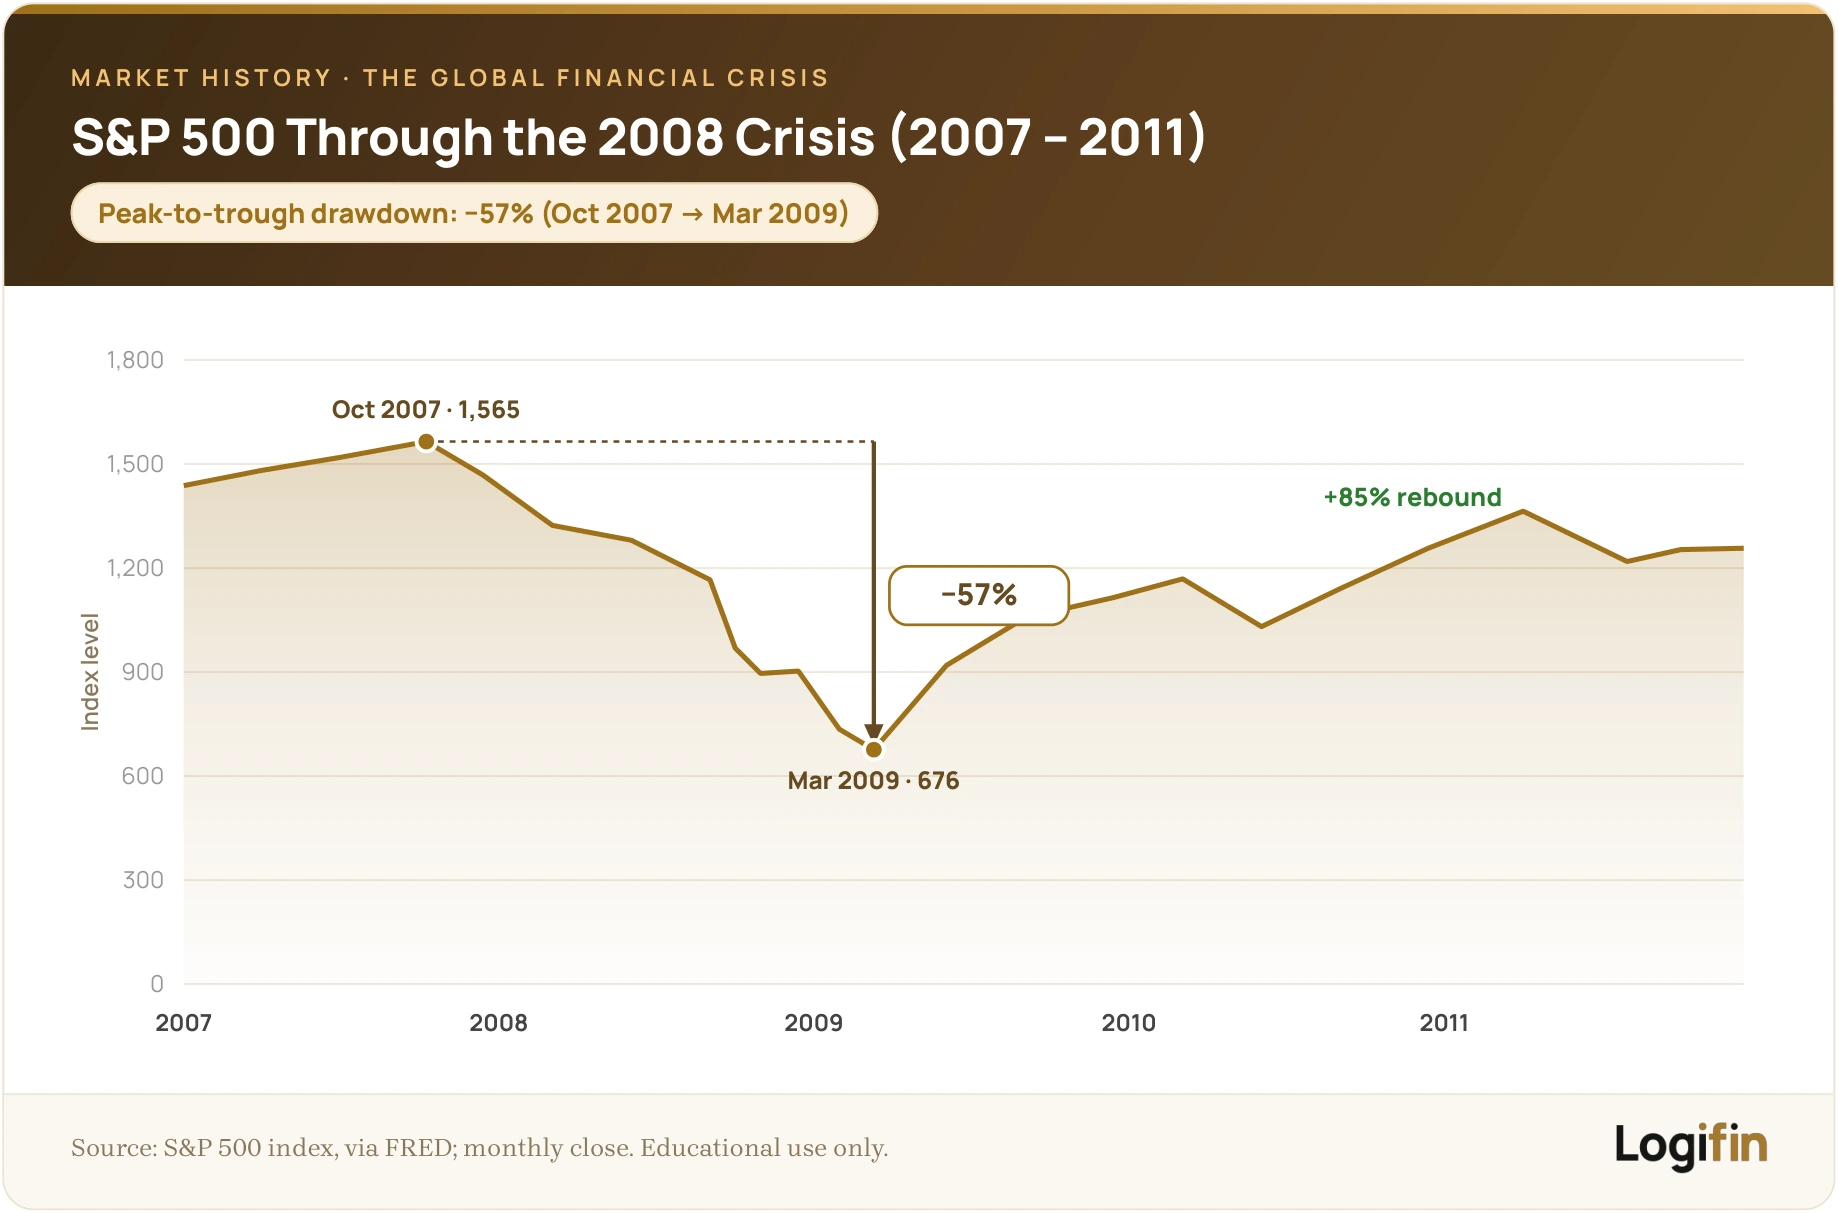
- Global Financial Crisis (2007–2009): The S&P 500 fell about –57% from October 2007 to March 2009, due to the collapse of the housing market and the banking system. Full recovery was achieved in 2013.
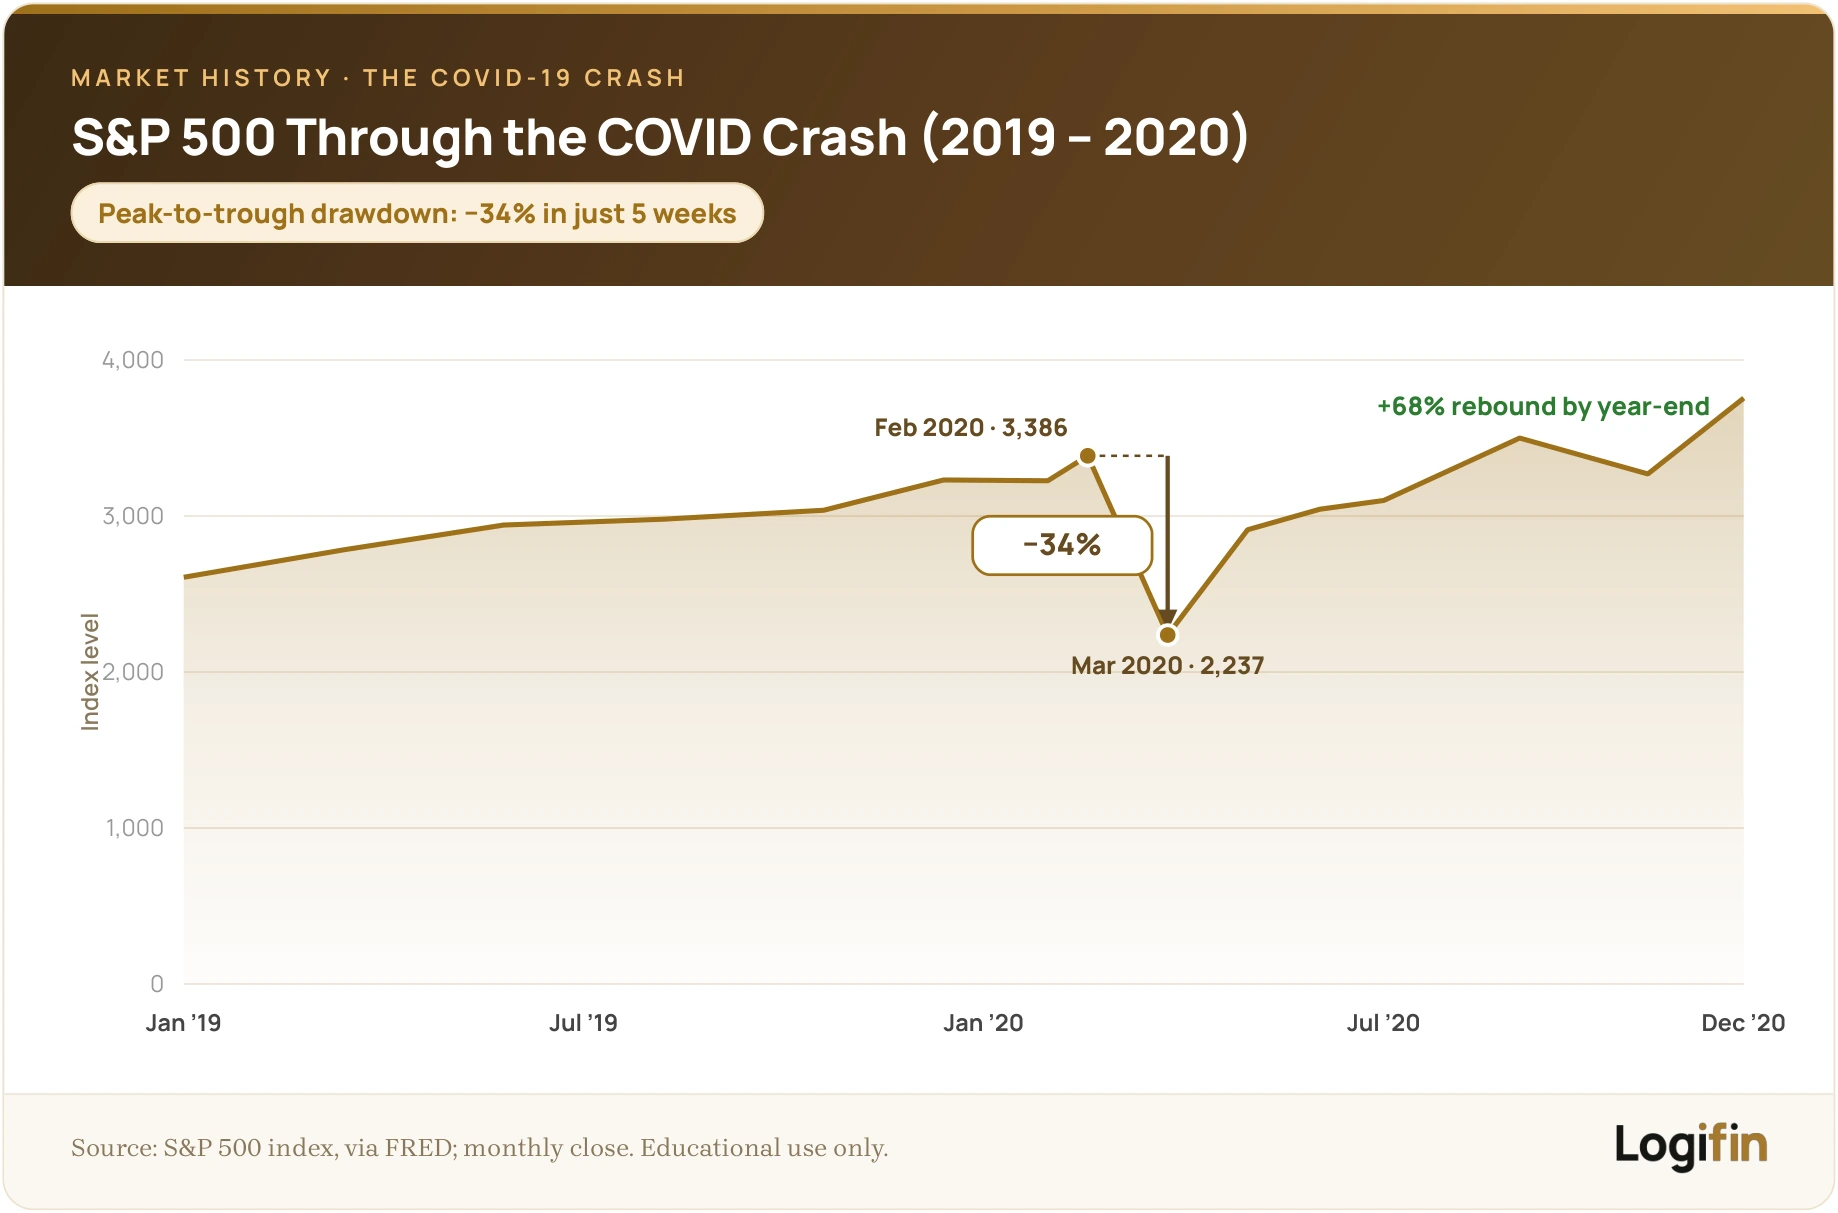
- Covid crash (March 2020): The S&P 500 tumbled about –34% in less than a month (20/2/2020–23/3/2020), due to the panic over the COVID-19 pandemic. One of the fastest recoveries in history followed: the index returned to new all-time highs as early as August 2020.
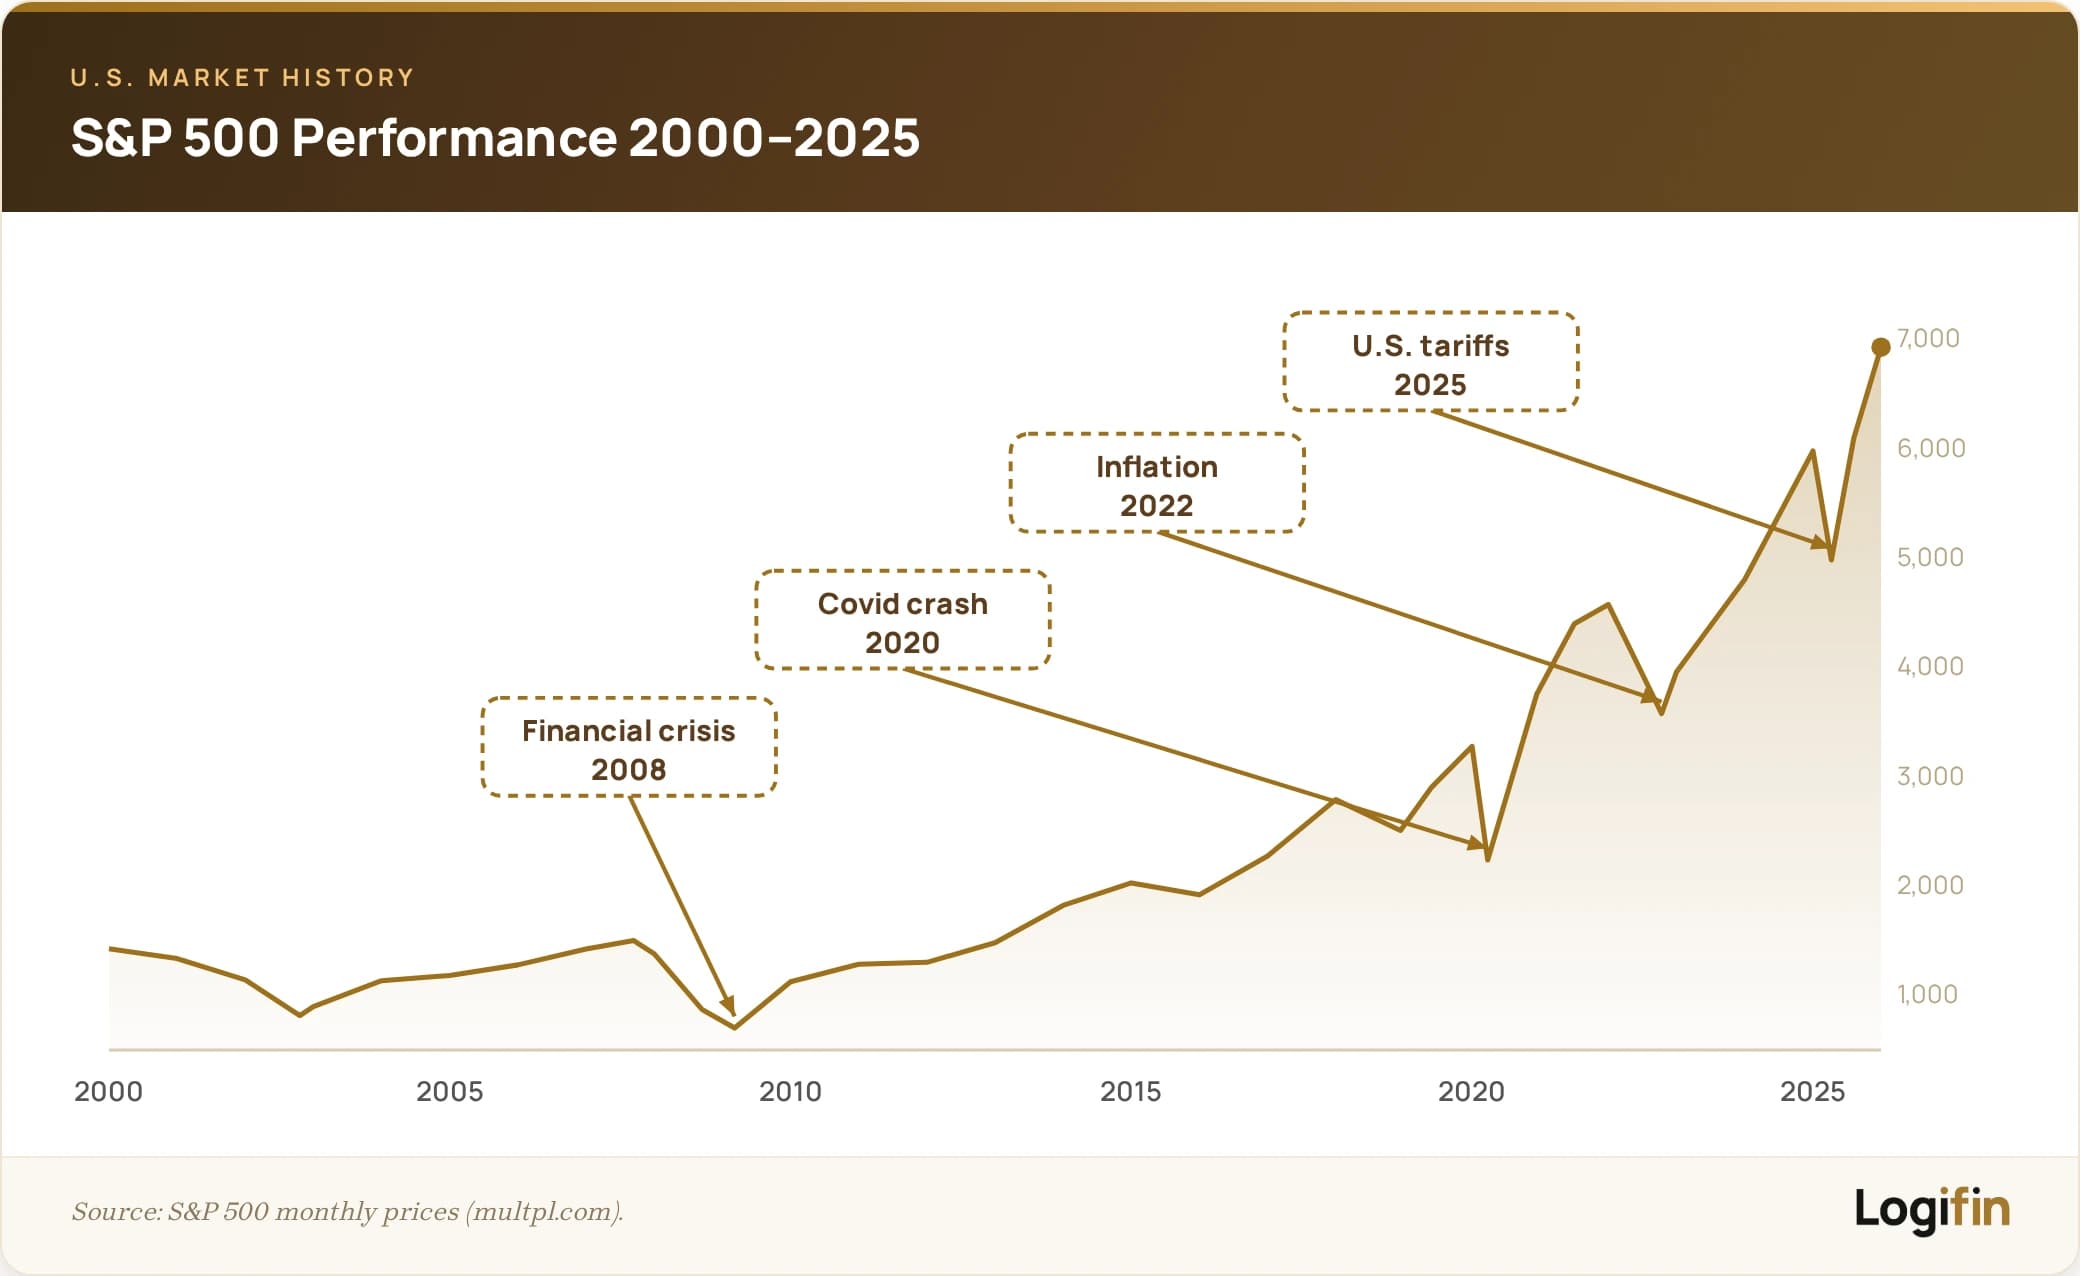
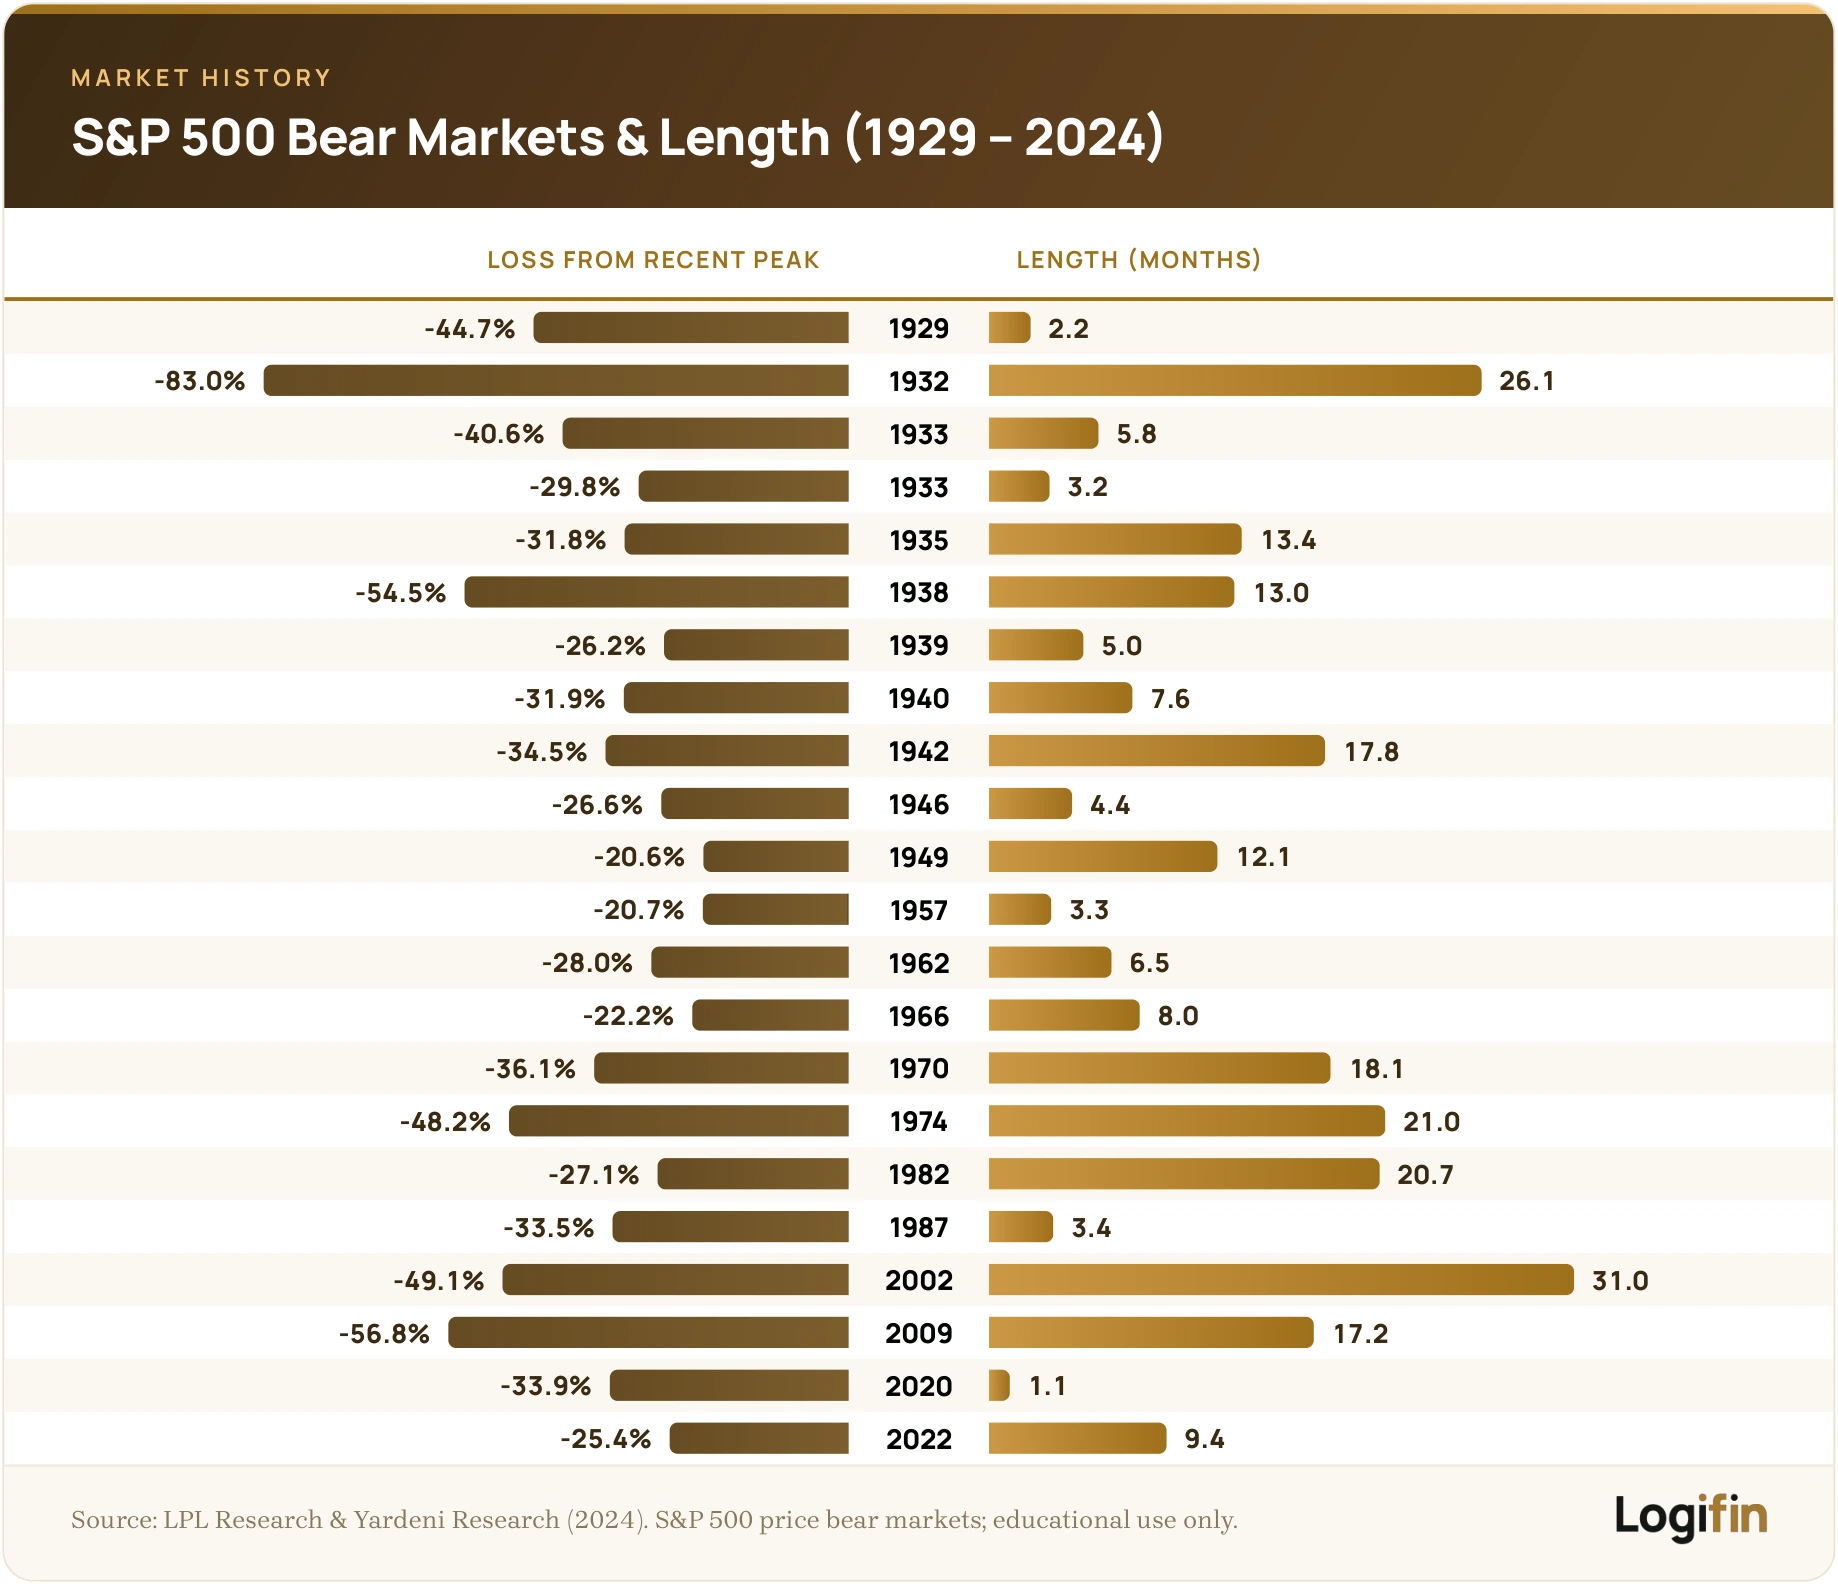
Since 1929, the S&P 500 has experienced more than 20 bear markets (declines of over –20%), but in every case it recovered and created new all-time highs.
🔶 Why does understanding bear markets matter?
- They are unavoidable: Every investor will go through several bear markets over a lifetime. Historically a bear market has appeared roughly every 3.5 years.
- They shape your strategy: When you understand them, you do not panic but instead see declines as opportunities. This is no coincidence: a significant share of the market’s best days has historically happened during bear markets or in the first weeks of the recovery, which is why staying invested matters.
- They build psychological resilience: When you know that declines are part of the "game", you can stay disciplined. It helps to know the numbers too: on average a bear market has lasted about 9 to 10 months, clearly shorter than a bull market (~2.7 years), with an average decline of around 35%.
The macroeconomic indicators that often give warning
Before every major bear market, the economy leaves traces behind it.
Macroeconomic indicators are not a crystal ball, but they offer valuable signals for when the economy starts to enter a risk phase.
If you learn to monitor them, you can prepare yourself psychologically and strategically.
🔶 Yield Curve Inversion
The "yield curve" shows the relationship between short-term and long-term interest rates on government bonds.
In a healthy economy, long-term interest rates are higher, since investors demand a greater return to "lock up" their money for many years.
When, however, short-term interest rates become higher than long-term rates, we have a yield curve inversion.
Example:
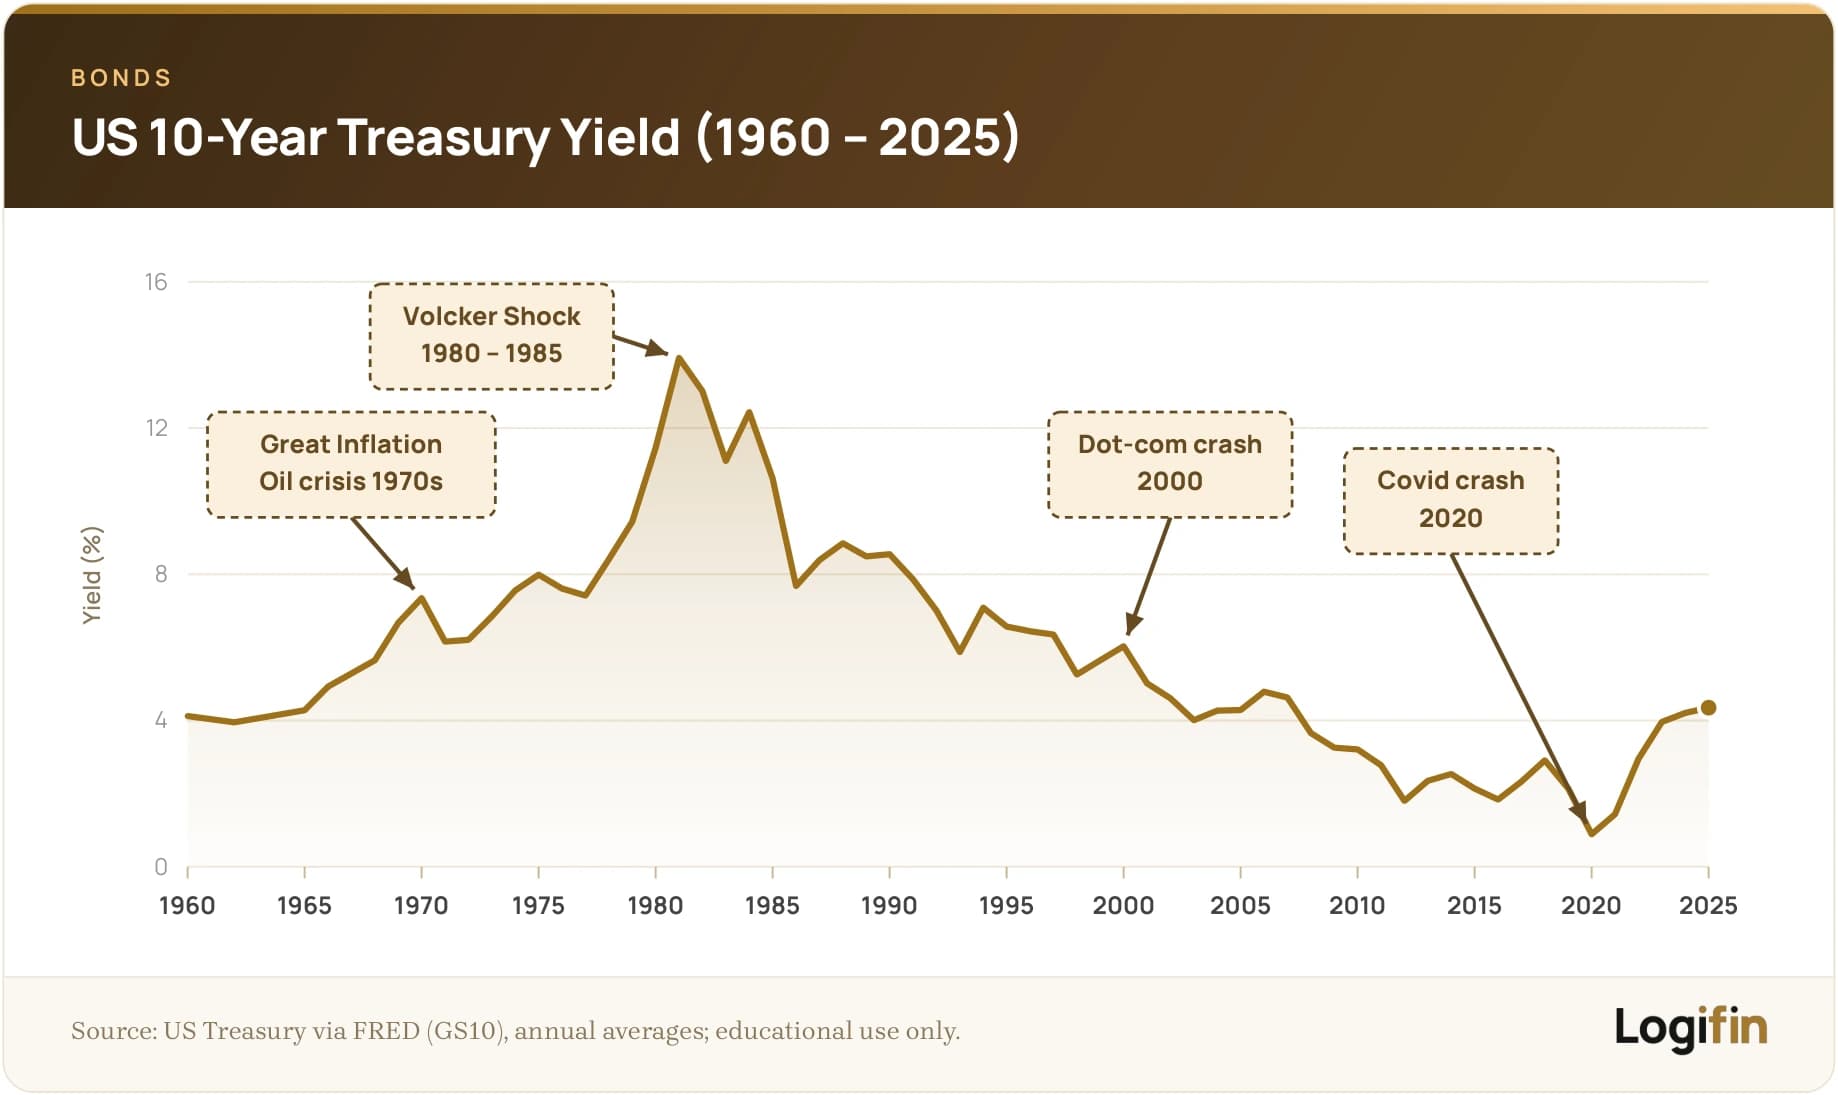
- In the United States, every recession since the 1950s has been preceded by an inversion of the yield curve.
- The same happened with the 2000 bubble and the 2007 crisis: first the curve inverted (10-year–2-year Treasury) and then a recession followed.
This is why the yield curve is considered one of the most reliable leading indicators of the economy.
🔶 Rising Unemployment
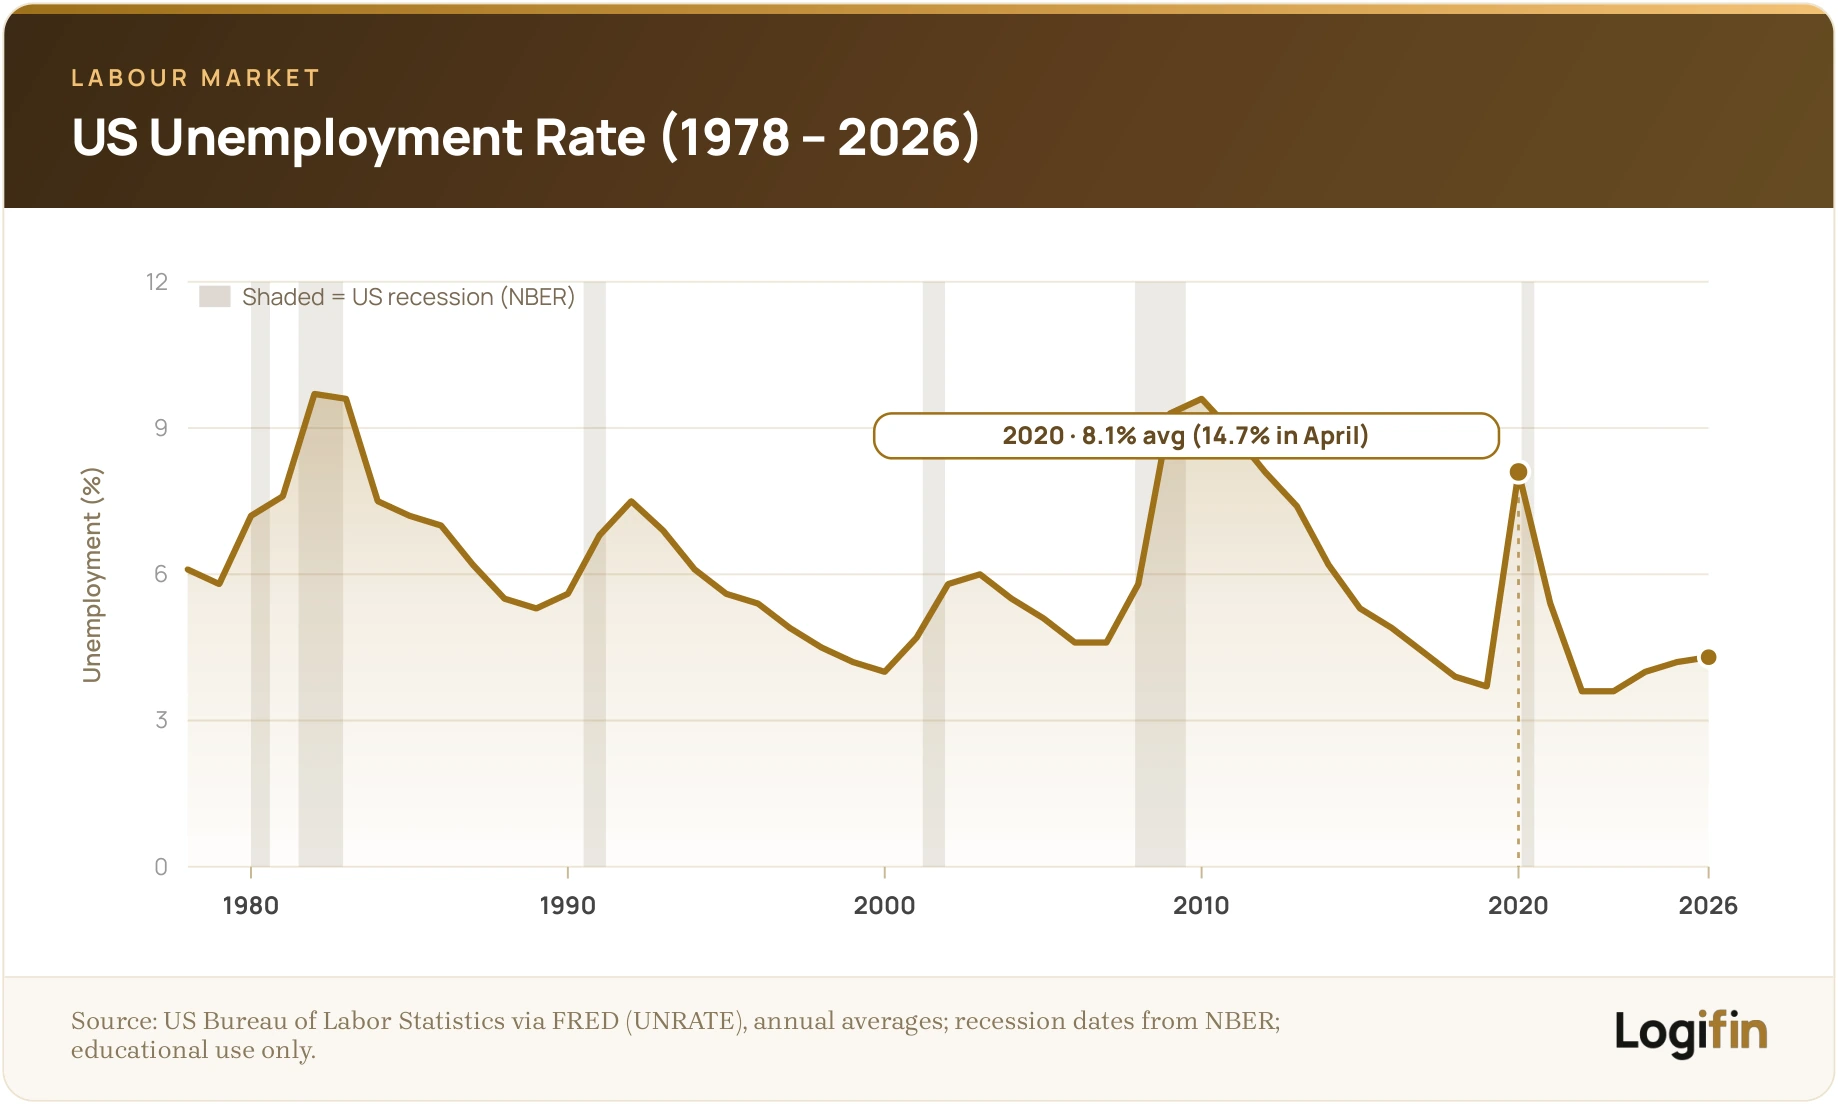
Unemployment is considered one of the most "lagging but reliable" indicators of the economy.
In periods of prosperity, unemployment tends to move at very low levels.
When, however, it starts to rise, it is a sign that the labour market has reached saturation and the economy is entering a slowdown.
- Businesses reduce hiring and begin layoffs.
- The drop in incomes hits consumption.
- The fall in demand creates a vicious cycle, reinforcing the recession.
Example: In 2007, unemployment in the United States started to rise months before the great crash of 2008. By 2009 it had reached double-digit levels, confirming the intensity of the crisis.
🔶 Production Indicators and the PMI
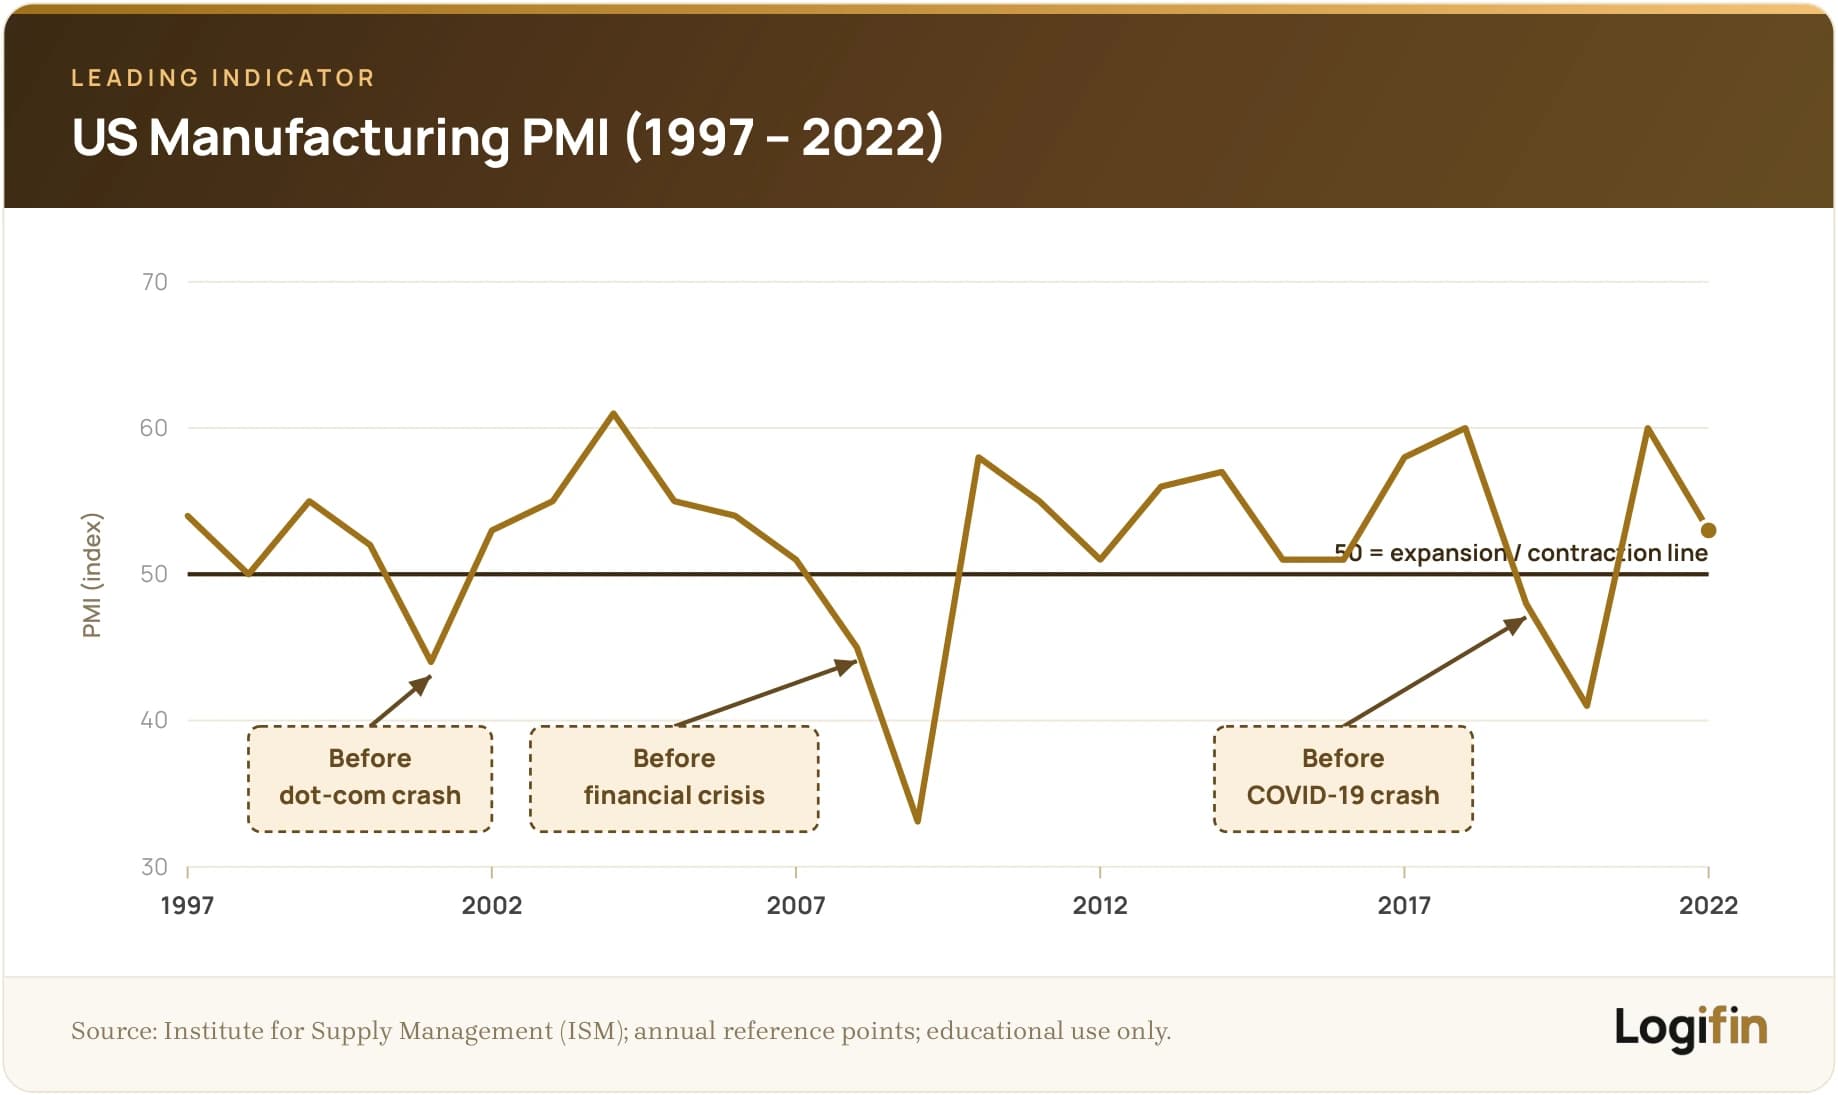
The PMI is an indicator that measures the course of business activity, based on surveys carried out among the purchasing managers of large companies.
It is one of the fastest and most "leading" indicators, because these managers are the first to see the course of orders, production and hiring.
- Values above 50 indicate growth.
- Values below 50 indicate slowdown.
- The lower the PMI falls, the stronger the signal for a recession.
The PMI is considered a "leading indicator", because it often shows the direction of the economy months before it is reflected in the more lagging indicators, such as unemployment.
Example: During the 2020 pandemic, the global PMI plunged below 40, recording the sharp drop in production and demand before it even fully showed up in GDP.
🔶 Monetary Policy of the Fed and Other Central Banks
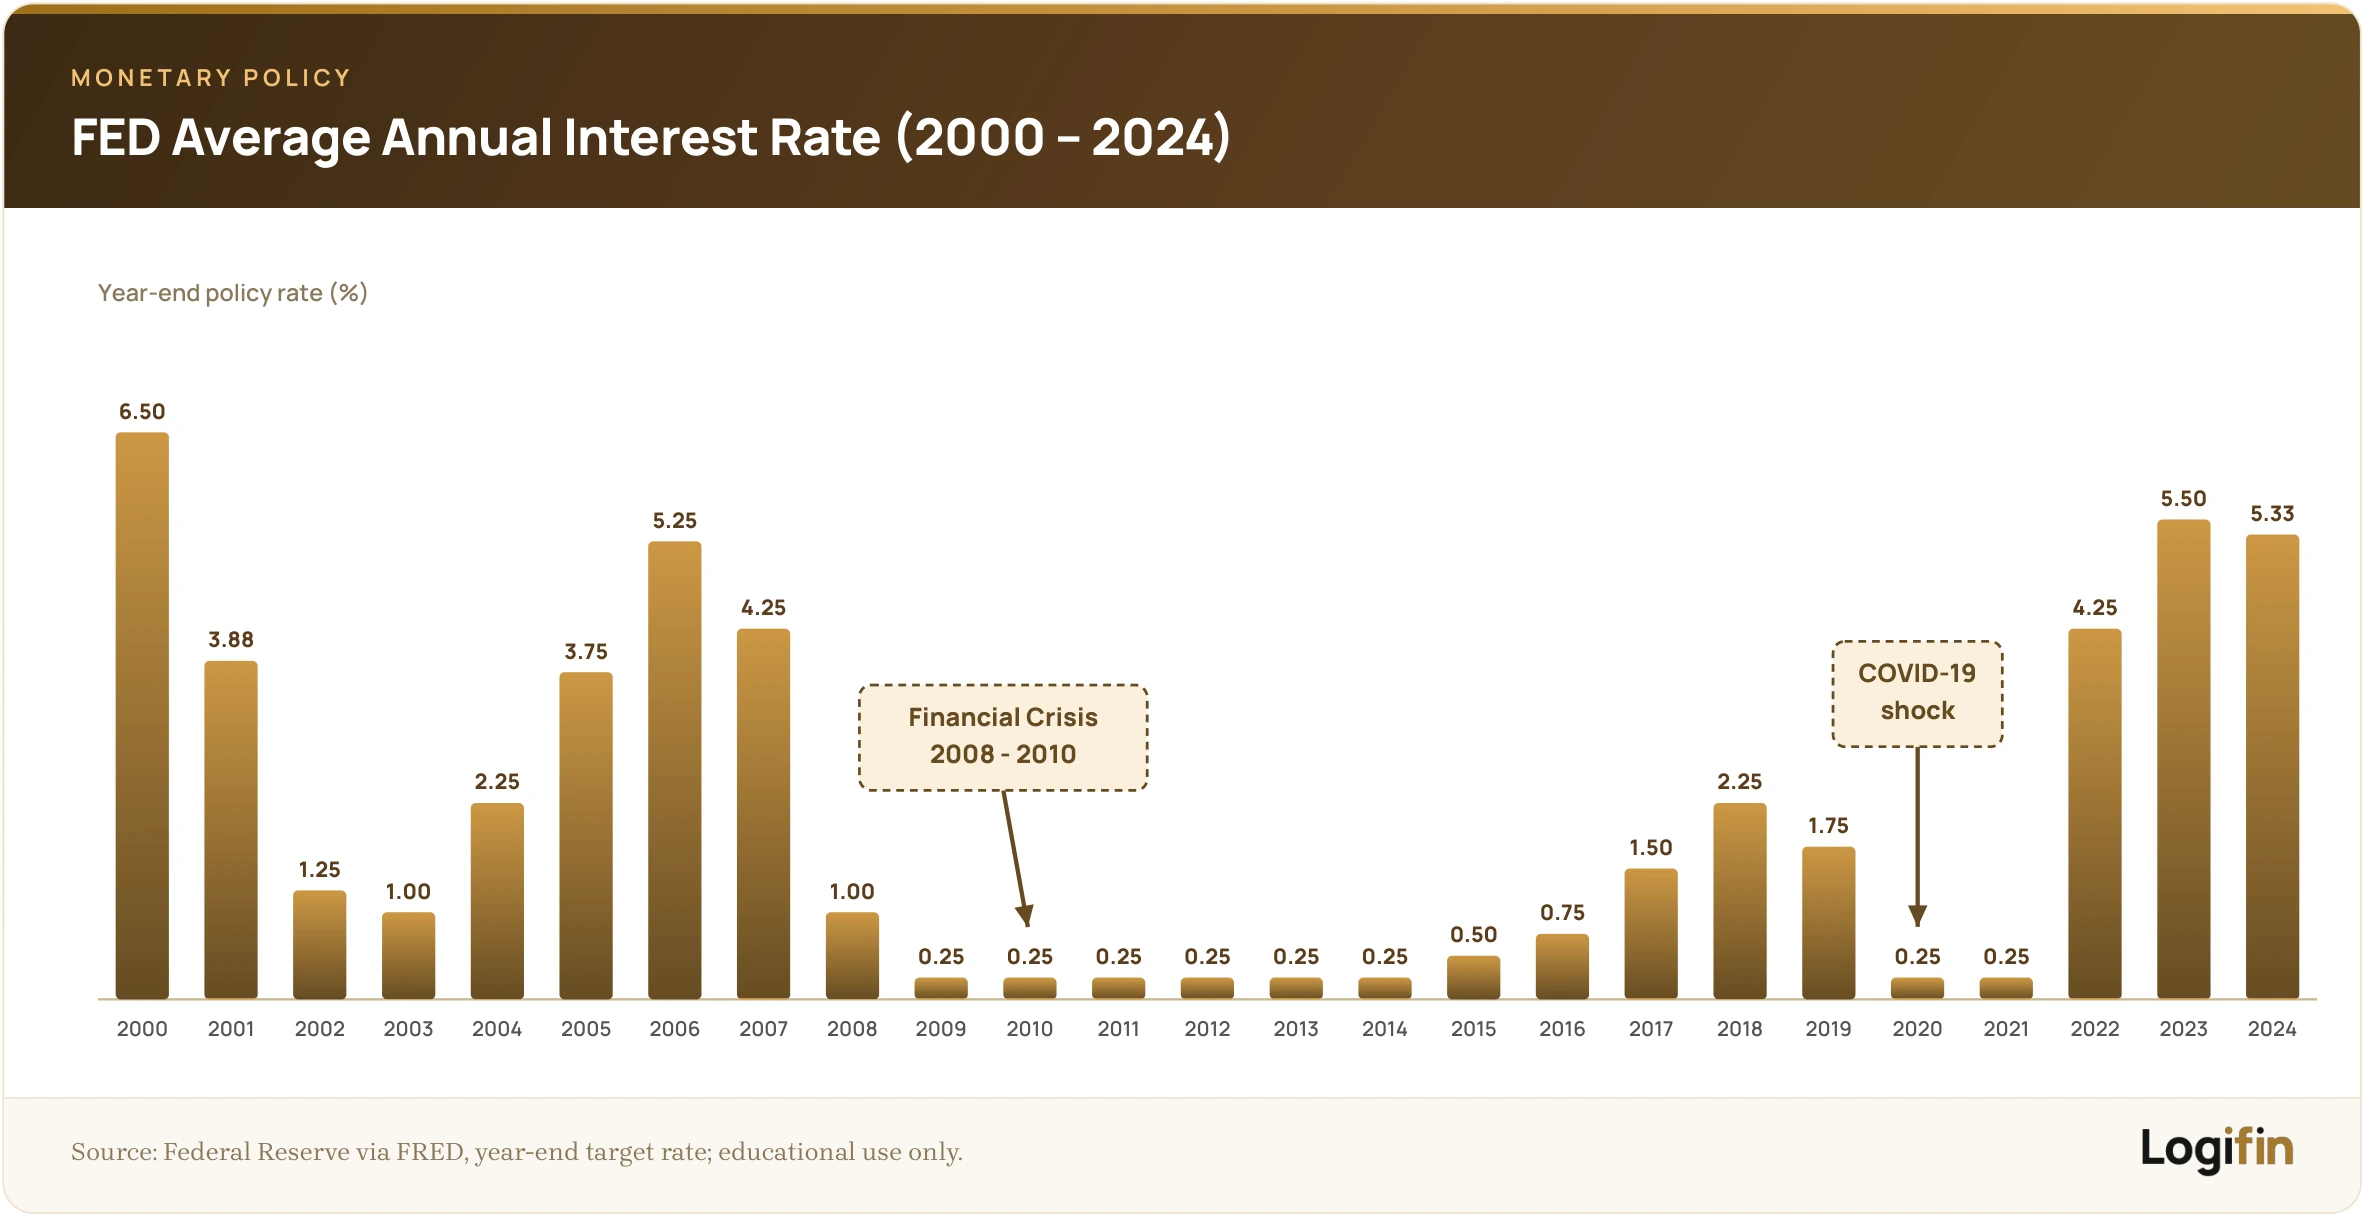
Monetary policy is perhaps the most direct factor that affects the economic cycle.
When central banks raise interest rates to curb inflation, they essentially "drain" liquidity out of the system.
This has knock-on effects:
- Loans become more expensive for households and businesses.
- Investments shrink, as the cost of capital rises.
- Consumption falls, directly affecting growth.
The markets often "read" the stance of the Fed and other central banks as a signal of where the economy is heading.
Very rapid interest-rate increases almost always raise the risk of recession.
Example:
- In 2022, the Fed started its most aggressive interest-rate hiking cycle in the past 40 years to curb inflation.
- The consequence was historic: bonds recorded their worst year of all time (Bloomberg Global Aggregate –16%) and stocks came under strong pressure, with the S&P 500 closing at –19%, the worst performance since 2008.
🔶 Inflation Out of Control
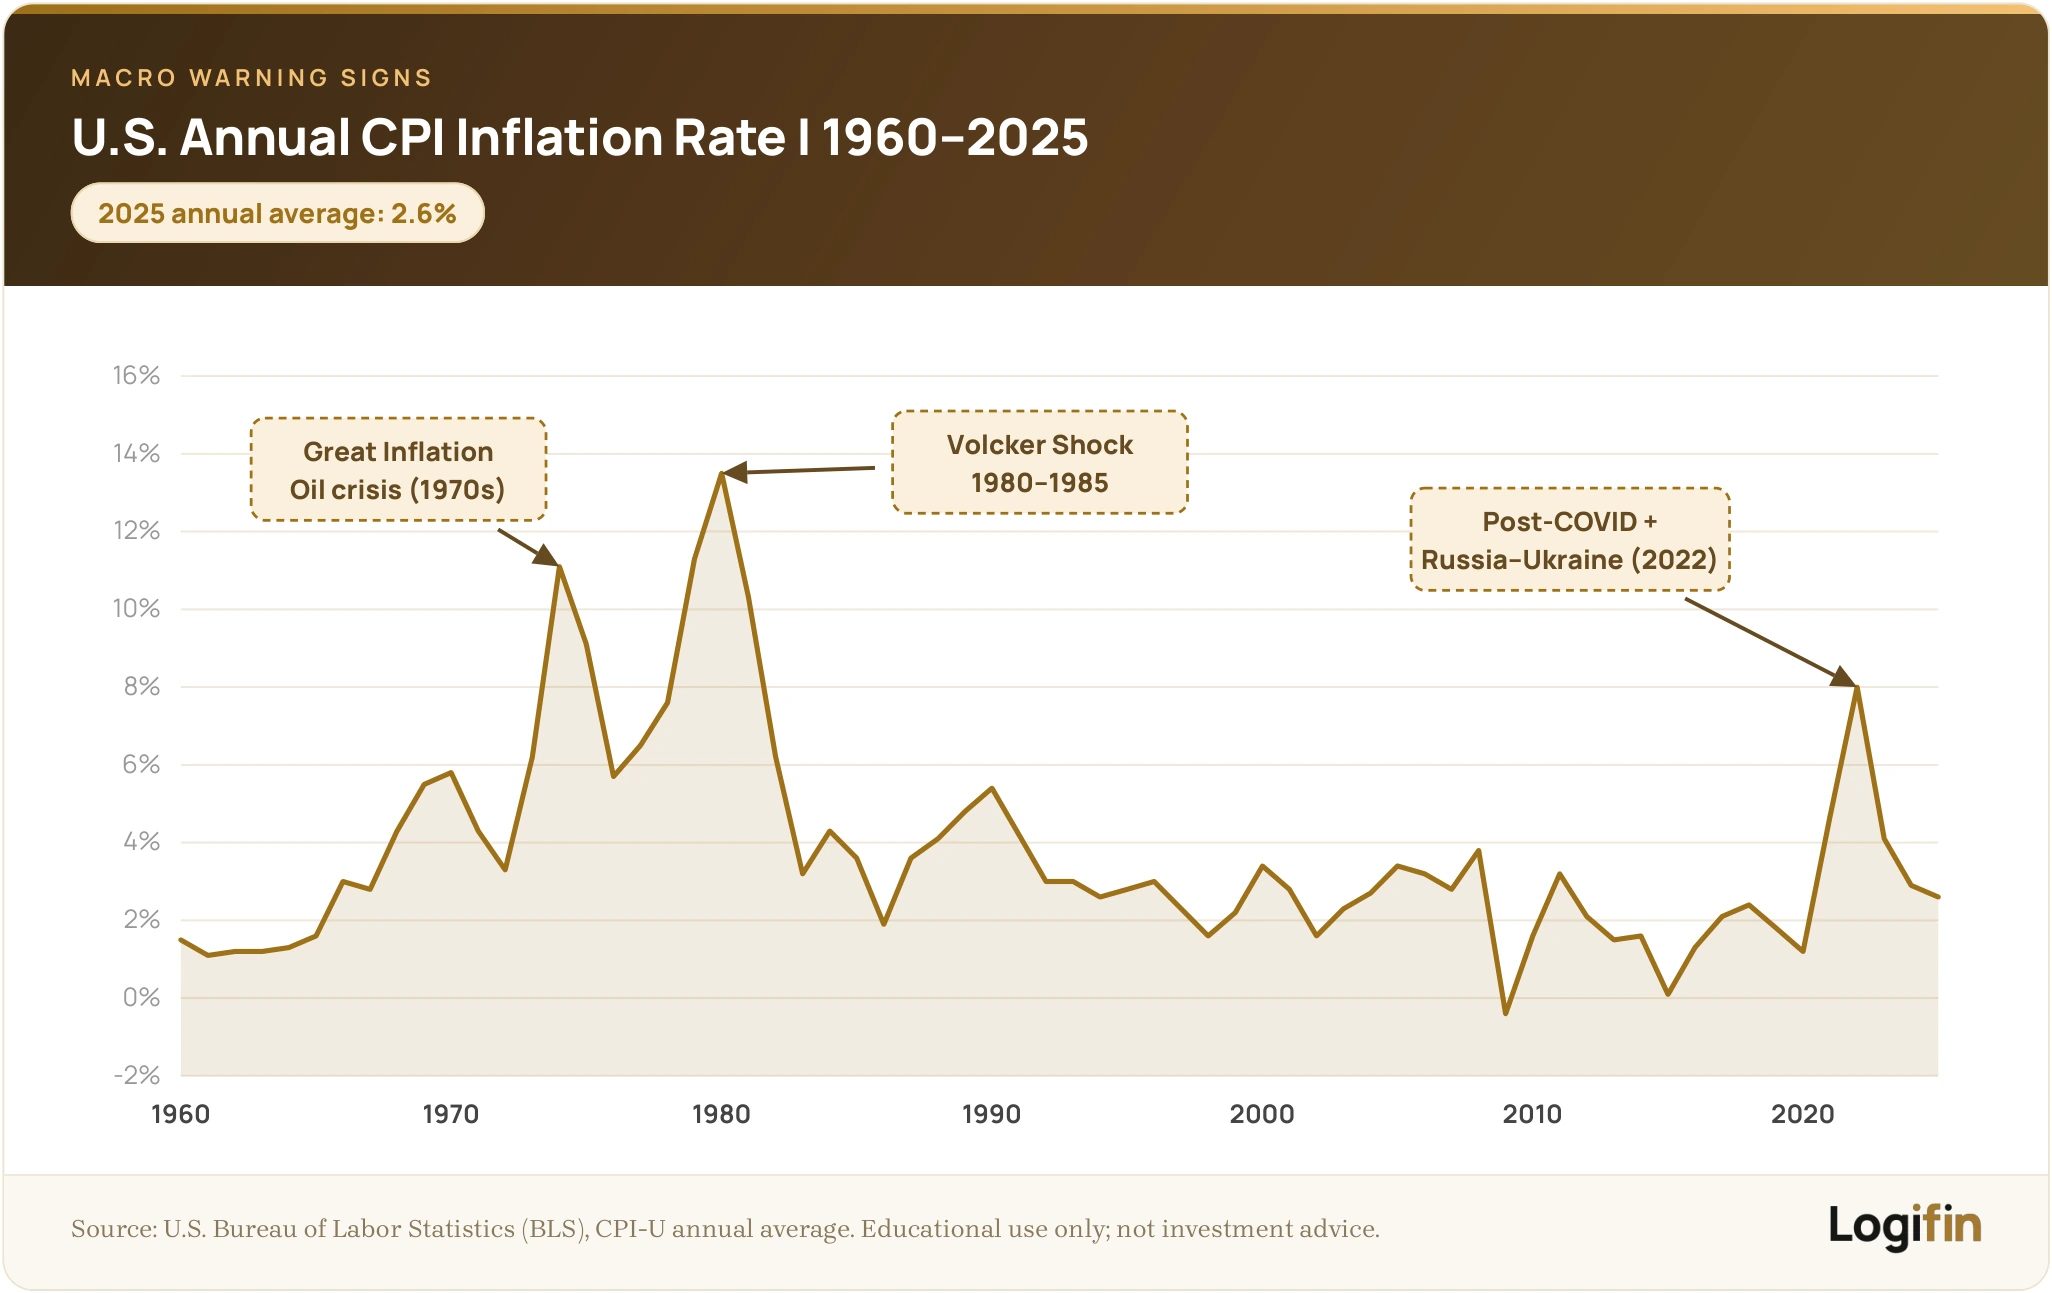
Inflation is by itself an enemy of investments, because it reduces the purchasing power of money.
When, however, it spirals out of control and combines with low growth, it creates the phenomenon of stagflation, one of the most difficult and dangerous scenarios for economies and investors.
In such periods, central banks are forced to raise interest rates aggressively, even if they know that this will hurt growth and lead to a recession.
The result is a "vicious cycle" with increased borrowing costs, reduced consumption and pressured markets.
Example:
- In the 1970s, inflation in the United States exceeded 12%, forcing the Fed to raise interest rates to double-digit levels (U.S. CPI).
- Stock markets experienced successive bear markets (1973–74, 1977–78, 1980–82) and, in real terms, the decade turned into a "lost decade".
- Investors were left with almost zero or negative returns for many years.
🔶 Additional Indicators Worth Watching
Beyond the "big" indicators such as the yield curve, unemployment and monetary policy, there are other important indicators that often give early warning signals for a recession:
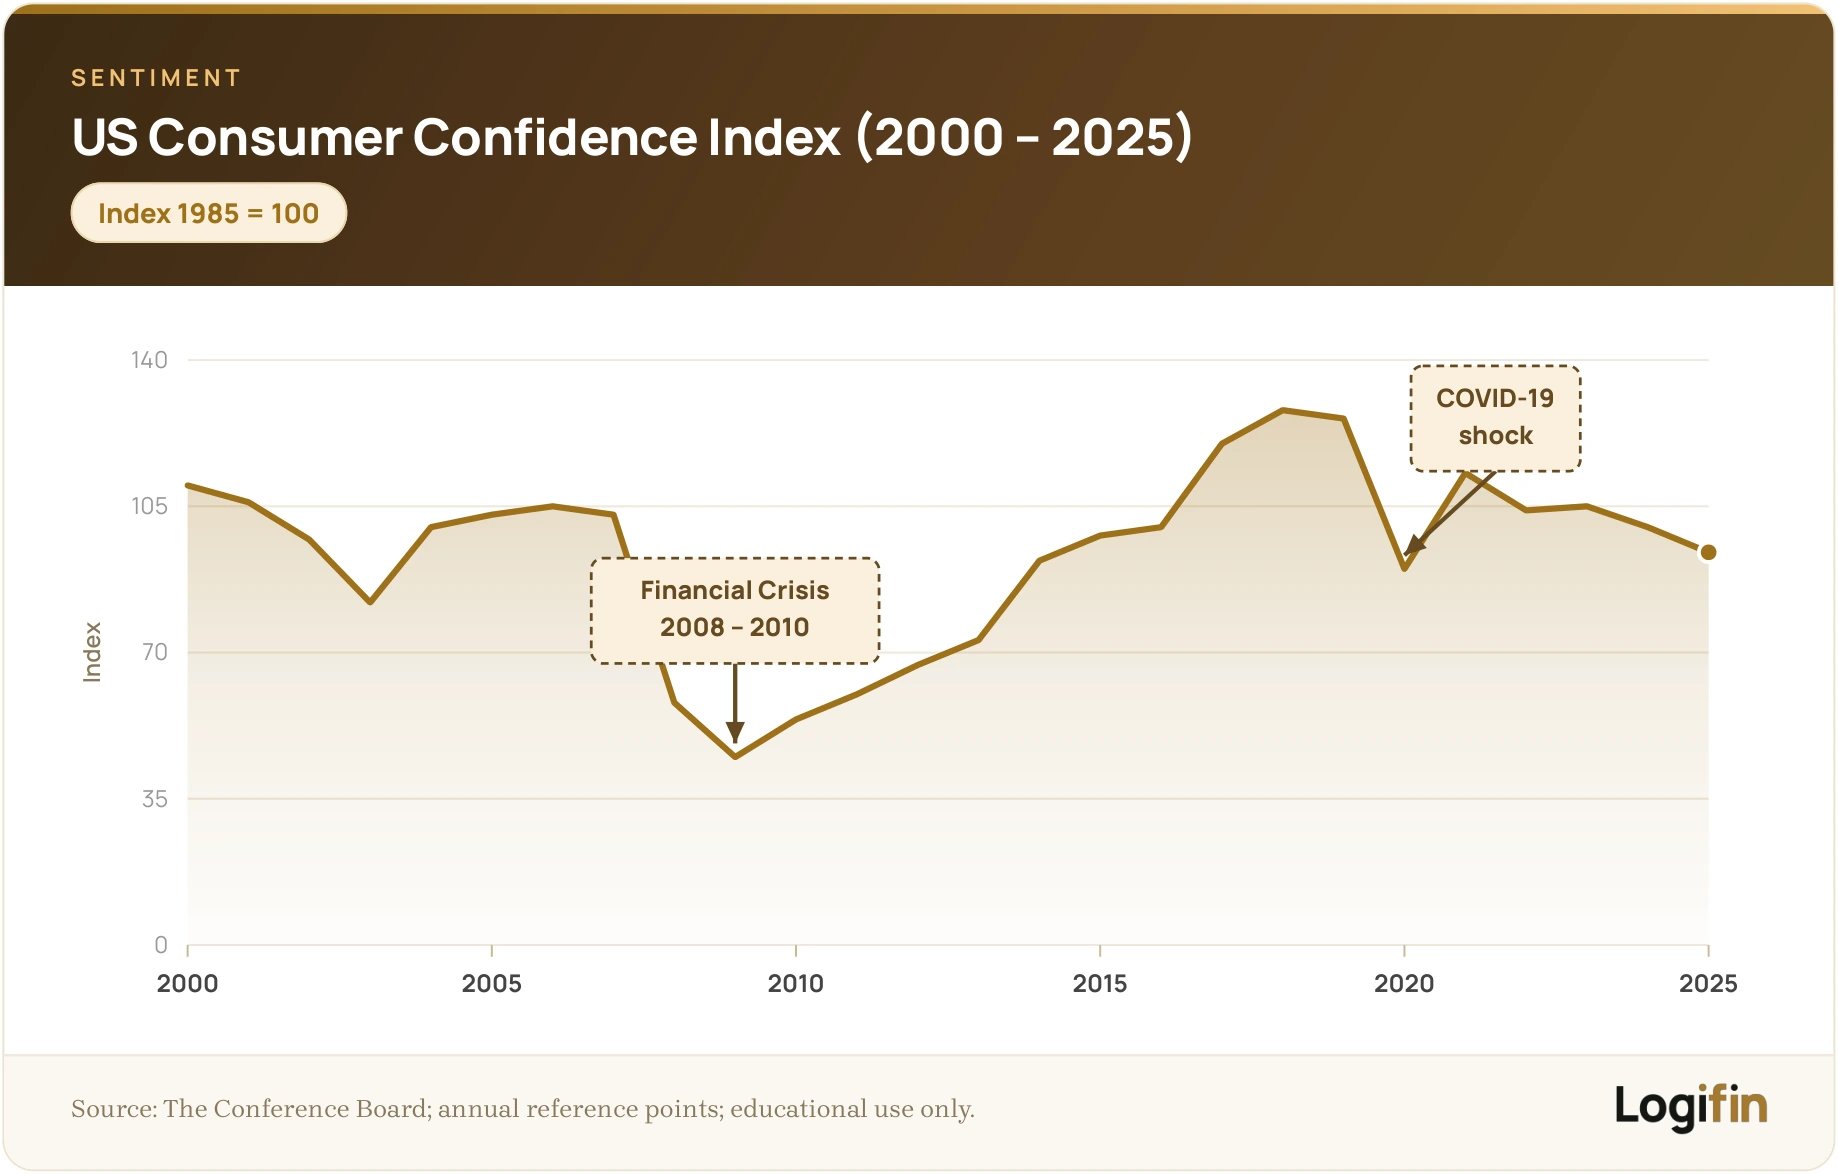
- Consumer confidence: When consumers become pessimistic about the future of the economy or of their personal finances, they cut back their spending. This has a direct impact on growth, since consumption makes up the largest part of GDP in most developed economies.
- Corporate profitability: Continuous profit declines at listed companies are often a "warning bell" for a slowdown. When profits retreat for several quarters, stock markets tend to price in a larger recession.
- Real-estate markets: A sharp fall in house prices is often a precursor to crises, because it directly affects the wealth of households and their ability to borrow.
Market behaviour before major declines
The markets often give their own "signals" before a bear market gets fully under way.
If you learn to recognise these patterns, you can understand in time that something is changing and prepare better.
🔶 Excessive Rise and Optimism (euphoria)
Almost always, a major decline is preceded by a period of excessive rise. Prices climb at a rapid pace, investors become over-optimistic and the feeling prevails that "the markets only go up".
In such phases, psychology often overcomes logic:
- Valuations shoot far above the fundamentals.
- The mass participation of new investors fuels an even greater rise.
- The media and analysts talk about a "new era" where the old rules no longer apply.
This psychology almost always leads to excesses that sooner or later correct, often in a violent way.
Example: In 1999, before the bursting of the dot-com bubble, technology stocks shot up to valuations that had no relation to their actual earnings.
🔶 Extreme Valuations
Valuations are one of the most useful long-term risk indicators.
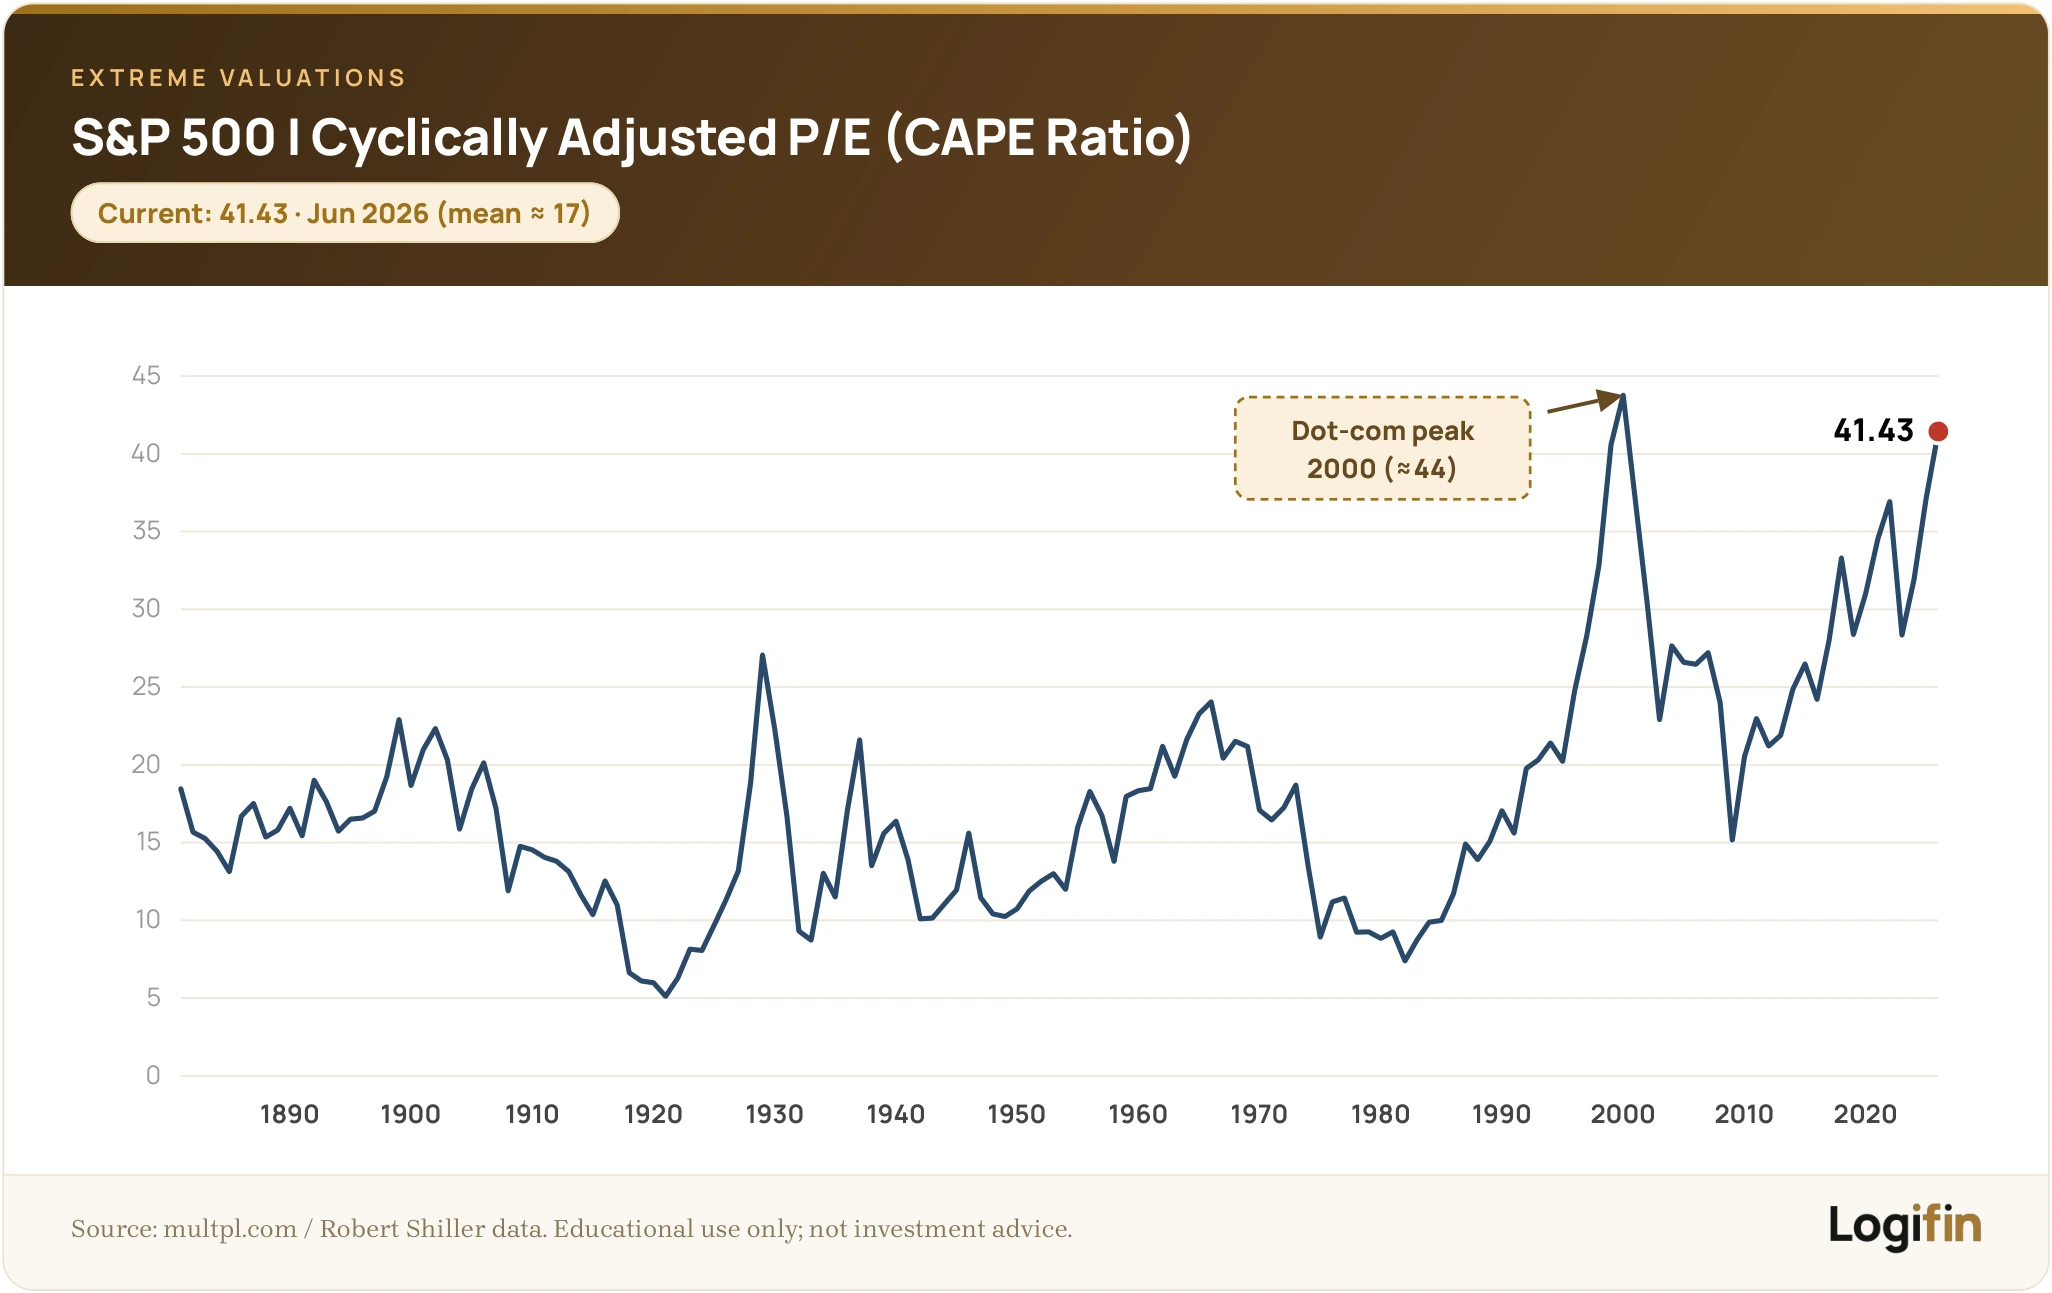
When indicators such as the P/E (Price-to-Earnings) or the CAPE ratio (Cyclically Adjusted P/E by Robert Shiller) move far above their historical average, the market is considered "overvalued" and more vulnerable to a correction.
Valuations act like gravity: the more prices stray from the fundamentals, the more likely they are to return closer to reality.
Markets can stay "expensive" for years, but when this combines with negative catalysts (for example interest-rate increases, a recession), the downside risk rises significantly.
Example:
- The CAPE ratio (Shiller P/E) of the S&P 500 exceeded 40 points in the 2000 bubble, reaching record levels (~44)
- This was more than two and a half times the indicator’s historical average (~17), pointing to the extreme overvaluation of the market in that period.
🔶 Increased Volatility
The market becomes more nervous when it approaches critical turning points. Sharp swings appear from day to day or even within the same trading session.
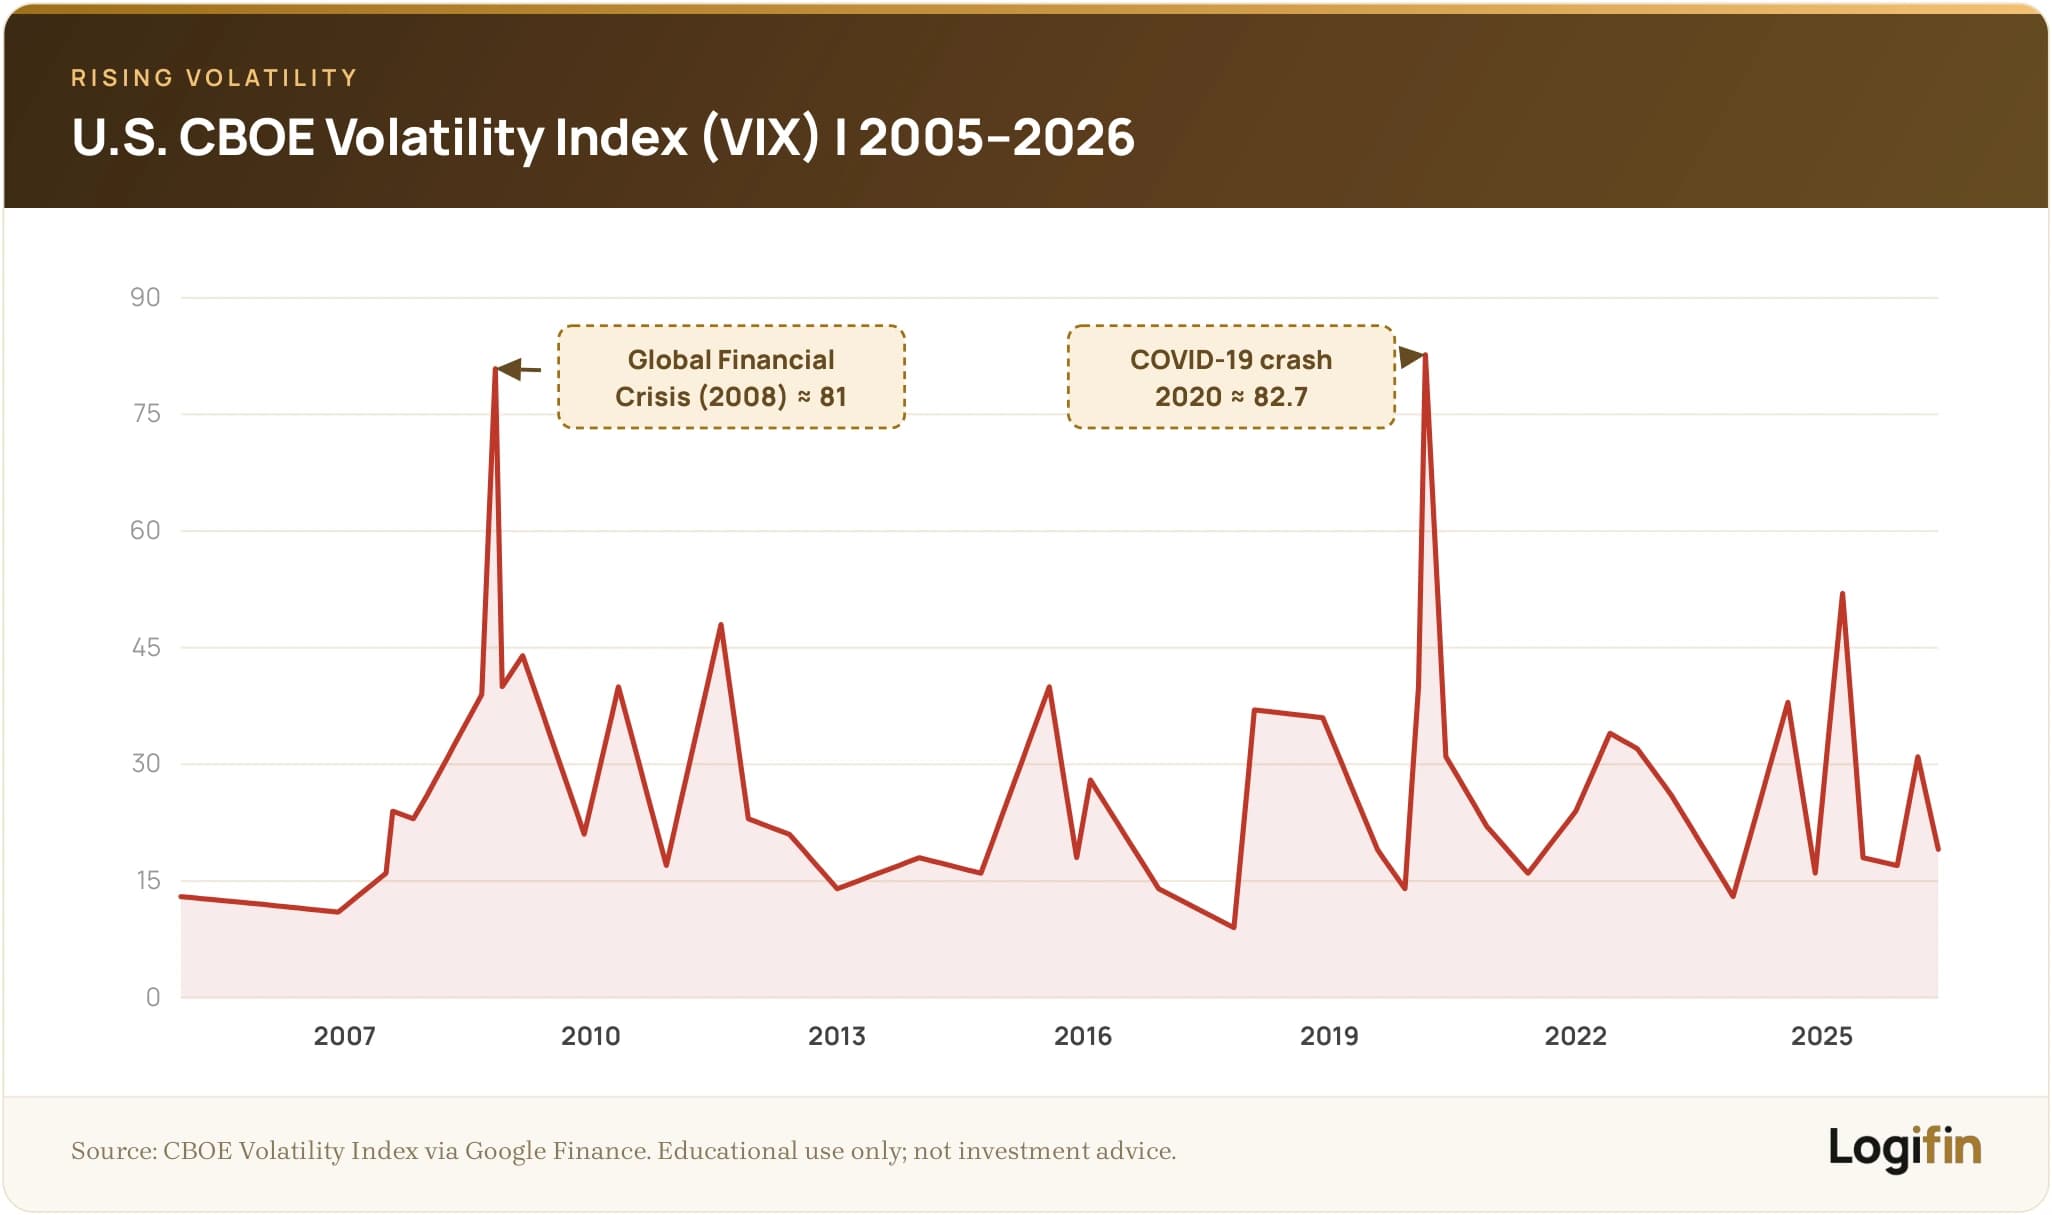
- The VIX index, also known as the "fear gauge", often rises before a bear market begins.
- Investors start paying more for options as protection, something that reflects the increased uncertainty.
- Volatility on its own is not always negative, but when it becomes systematic, it is a "warning bell" for increased risk.
Example: At the outbreak of the pandemic in March 2020, the VIX index spiked to 82.7 points, levels not seen since the financial crisis of 2008.
🔶 Weakening Corporate Earnings
Corporate earnings are the "mirror" of the real economy.
When many companies start to report lower earnings, the message is clear: demand is falling or costs are rising.
- Disappointing earnings announcements shake investor confidence.
- Analysts lower their estimates, leading to lower valuations.
- This opens the way for a broader correction in the markets.
Example:
- In 2007, the large banks of the United States started to report huge losses from high-risk mortgage loans (known as subprime).
- These were loans that had been given to borrowers with low creditworthiness, who struggled to pay their instalments.
- When the mass delays and payment defaults began, the value of these loans collapsed, causing chain-reaction losses at the banks and triggering the great financial crisis of 2008.
🔶 Signs of Excessive Leverage
Leverage means investing with borrowed money. When investors borrow excessively (margin debt) to boost their returns, the market becomes more vulnerable.
In a decline, brokers demand additional collateral (margin calls) and investors are forced to sell en masse.
This creates a vicious cycle of forced selling that accelerates the downward course.
- In periods of rise, leverage acts as an accelerator of profits.
- In periods of decline, it becomes "fuel" that makes the fall more violent.
- The higher the levels of leverage in the market, the more unstable it becomes in periods of crisis.
Example: Margin debt in the United States reached historic highs shortly before the 2000 crash (dot-com bubble) and again in 2007 before the financial crisis, worsening the decline.
Investor psychology before a bear market
Beyond the economic data and the markets, investor psychology also plays a decisive role.
The markets move not only from profits and numbers, but also from emotions: fear, greed, doubt.
🔶 Over-optimism and "FOMO"
Shortly before major declines, the feeling prevails that "the market only goes up".
Investors are swept up by the fear that they will "be left out" (FOMO – Fear of Missing Out) and pour in money without a second thought, pushing prices even higher.
- Logic gives way to emotion.
- Valuations move beyond any realistic measure.
- New, unprepared investors enter the market en masse.
Example: In the dot-com bubble (1999), thousands of investors bought shares of internet companies that had neither profits nor viable business models, only so as not to miss the "opportunity".
🔶 The Illusion That "This Time Is Different"
In every upward cycle the same phrase appears: "This time things are different".
Investors convince themselves that the new technologies, the new markets or the new economic conditions justify the excessive prices and that the old rules no longer apply.
- This belief fuels the over-optimism.
- It creates the illusion of safety, even when the fundamentals do not support it.
- When reality returns, the correction is usually violent.
🔶 Disbelief and Denial
When the first declines begin, many investors do not take them seriously.
They consider it to be simply a "temporary correction" or a "buying opportunity" and continue with the same strategy.
- They underestimate the warning signs.
- They believe that "the market always comes back immediately".
- They do not realise that a real bear market may be starting.
Example: In early 2008, several investors believed that the fall in bank stocks was a "technical correction", shortly before the financial system entered the worst crisis of the past few decades.
🔶 Panic and Mass Selling
When the decline deepens and exceeds 20% (the typical threshold for defining a bear market), fear takes over.
Many investors move from denial to panic.
- Those who entered the market because of FOMO are the first to rush out.
- They often sell at the worst possible point, close to the "bottom" of the market.
- This creates a wave of mass selling that accelerates the decline.
Example: In the "Covid crash" of March 2020, the indices plunged ~34% within a few weeks. The panicked selling pushed the market lower, shortly before one of the fastest recoveries in history began.
How can you prepare as an investor?
A recession is certain to happen again; the only thing we do not know is when.
Proper preparation does not mean you can avoid it, but that you will withstand it and, if you are strategic, come out stronger.
🔶 Build an emergency fund
The first step is not an investing one but a defensive one.
Before you start building a portfolio, you need an emergency fund that covers 3–6 months of basic expenses.
This is placed in a simple, safe savings or term-deposit account, not in the market.
- It protects you when the market falls or when an unexpected need arises (for example job loss or health expenses).
- It prevents the worst mistake an investor can make: selling investments at the bottom just to cover daily expenses.
- It gives you psychological calm so you can let your long-term investments work without stress.
Example: If your fixed expenses are 1,800 €/month, then you need roughly 5,400–10,800 € in easily accessible cash to cover basic needs for 3–6 months.
🔶 Portfolio diversification
A recession does not hit all assets in the same way.
A well-diversified portfolio reduces losses during crises and offers you greater stability and resilience over time.
In practice, this means combining different asset classes:
- Stocks. They are the main engine of growth over time. They offer higher returns, but also greater volatility.
- Bonds. They act as a stabilizer of the portfolio. They offer lower volatility and often more predictable income.
- Gold or other real assets. They can act as a hedge in periods of inflation, geopolitical tension or crises of confidence in the financial system.
- Cash. It provides liquidity and flexibility. It lets you take advantage of buying opportunities when markets are falling, without being forced to sell other assets.
Diversification does not protect you from every decline. But it protects you from the big loss that can push you out of the game for good.
And that is the most important element for an investor who thinks long term.
🔶 Consistency with DCA
The Dollar Cost Averaging (DCA) strategy is probably the most effective tool during a bear market.
Instead of trying to time the market, you invest the same fixed amount every month, regardless of whether prices go up or down.
- When prices fall, you buy more units with the same amount.
- When prices rise, you buy fewer, but you have already built up positions at lower levels.
- So your average acquisition cost falls and when the recovery comes, your gains are larger.
🔶 Prepare your psychology
- Bear markets are not only economic events; they are also psychological tests.
- A 30–40% drop in your portfolio can make you feel that everything is being lost and lead you to the biggest mistake: selling at the bottom.
- Psychological pressure makes you see losses as permanent, when in reality they are temporary.
- History has shown that markets always recover, but only those who stay invested enjoy the recovery. Composure is often more valuable than any technical strategy.
Remember that bear markets are phases of the cycle and not the end of the market. If you have built a sound plan and an emergency fund, composure is your strongest weapon.
Example: In the 2020 crisis, those who sold at the market bottom needed months or years to recover their losses. But those who held their positions saw their portfolios return to new highs in less than a year.
🔶 Re-examine your risk and your portfolio allocation
Bear markets are the best stress test for your portfolio.
That is where you see whether the allocation you have chosen truly matches the level of risk you can bear.
- If you panic at a 20% decline, you probably have too much exposure to stocks or other risky assets.
- If you stay calm and follow your plan, then your strategy is properly aligned with your psychology and your goals.
Re-examining does not mean changing everything in the middle of a bear market; it means drawing conclusions about how you should shape your allocation in the future.
Example: If a portfolio of 80% stocks / 20% bonds frightens you at the first correction, it may be better to move to a more conservative ratio (for example 60% stocks / 40% bonds).
🔶 Keep flexibility
Preparing for a recession does not mean rigidity.
Markets do not move only downward; significant opportunities also appear during periods of decline.
Quality companies, with healthy balance sheets and steady earnings, often trade at bargain prices when fear dominates the market.
- Keep a portion of liquidity in your portfolio, so you have the ability to take advantage of such opportunities.
- Do not get trapped in inaction; the strategy must adapt to conditions.
- Flexibility gives you an advantage over investors who are forced to stay idle due to a lack of cash.
Bear markets are often like sale periods for patient investors.
As with big sales, the key is to buy quality products (strong companies) and not whatever is cheap.
Conclusion and practical takeaways
Bear markets are not "accidents" of the market; they are a natural part of the economic cycle.
For the investor who expects them, understands them and prepares for them, they can be not only a period of testing but also an opportunity.
🔑 What to Keep in Mind
- Bear markets are inevitable and appear again and again throughout history.
- Macroeconomic indicators (yield curve, unemployment, PMI, inflation) often give early signals.
- The market and investor psychology have patterns: over-optimism → fear → panic.
- Preparation (emergency fund, diversification, DCA, a long-term view) is the secret to coming out stronger.
- History shows that the markets always recover and create new all-time highs.
Practical tips for new investors:
1️⃣ Do not try to predict the market: focus on your strategy.
2️⃣ Maintain your discipline even when the news headlines provoke fear.
3️⃣ Take advantage of the declines as an opportunity to buy quality assets at lower prices.
4️⃣ Keep a long-term perspective: bear markets last a few years, but your investments may last decades.
The content of this article is provided exclusively for informational and educational purposes and does not constitute investment advice or a recommendation to buy or sell financial products. The information is based on publicly available sources considered reliable, without any guarantee of accuracy or completeness. Before making any financial or investment decision, it is recommended that you consult a certified professional advisor or accountant, taking into account your own financial situation and risk profile. The Logifin team bears no responsibility for any direct or indirect damages arising from the application of the information presented.
Related articles

What is a recession and how it affects investors?
How a recession is defined, what causes one, how the markets usually behave during it and what an investor can do to prepare in advance.
24 min read

What is hedging and when do we need it?
What hedging is, which tools investors use for it, what it costs in giving up return and when a private investor genuinely needs it.
17 min read

DCA: The most stable investment strategy
What dollar cost averaging is, how it lowers risk and when it beats lump sum investing.
15 min read

Minimalism and investing: Can they coexist?
How the idea of less but better organises your spending and leads to a simple portfolio you can hold for years without second guessing it.
14 min read
EXPLORE LOGIFIN
Everything you need in order to learn, plan and track your investments.
Logifin Blog
Learn everything you need to get your finances in order and invest with confidence.
Logifin Insights
What moves the markets and what it means for a long term investor. Short and without the noise.
Logifin Tools
Free, inside the site, no signup. Everything you calculate stays on your device.
Logifin ETF Hub
Find the ETF that fits you: 550+ UCITS ETFs, smart filters and in-depth comparisons.
Logifin Guides
A series of guides that builds your investment plan step by step. The first guide is free for everyone.
Logifin Circle
The tools and the Hub are free for everyone. You become a member for the intelligence that never stops.