Logifin Insights
Black Thursday on Wall Street
The S&P 500 lost 4.4% on 5 November, its worst day since April 2025. The Nasdaq entered correction territory and the VIX surged. Why the US elections hit artificial intelligence stocks and what that means for anyone who holds an ETF.
· 10 min read

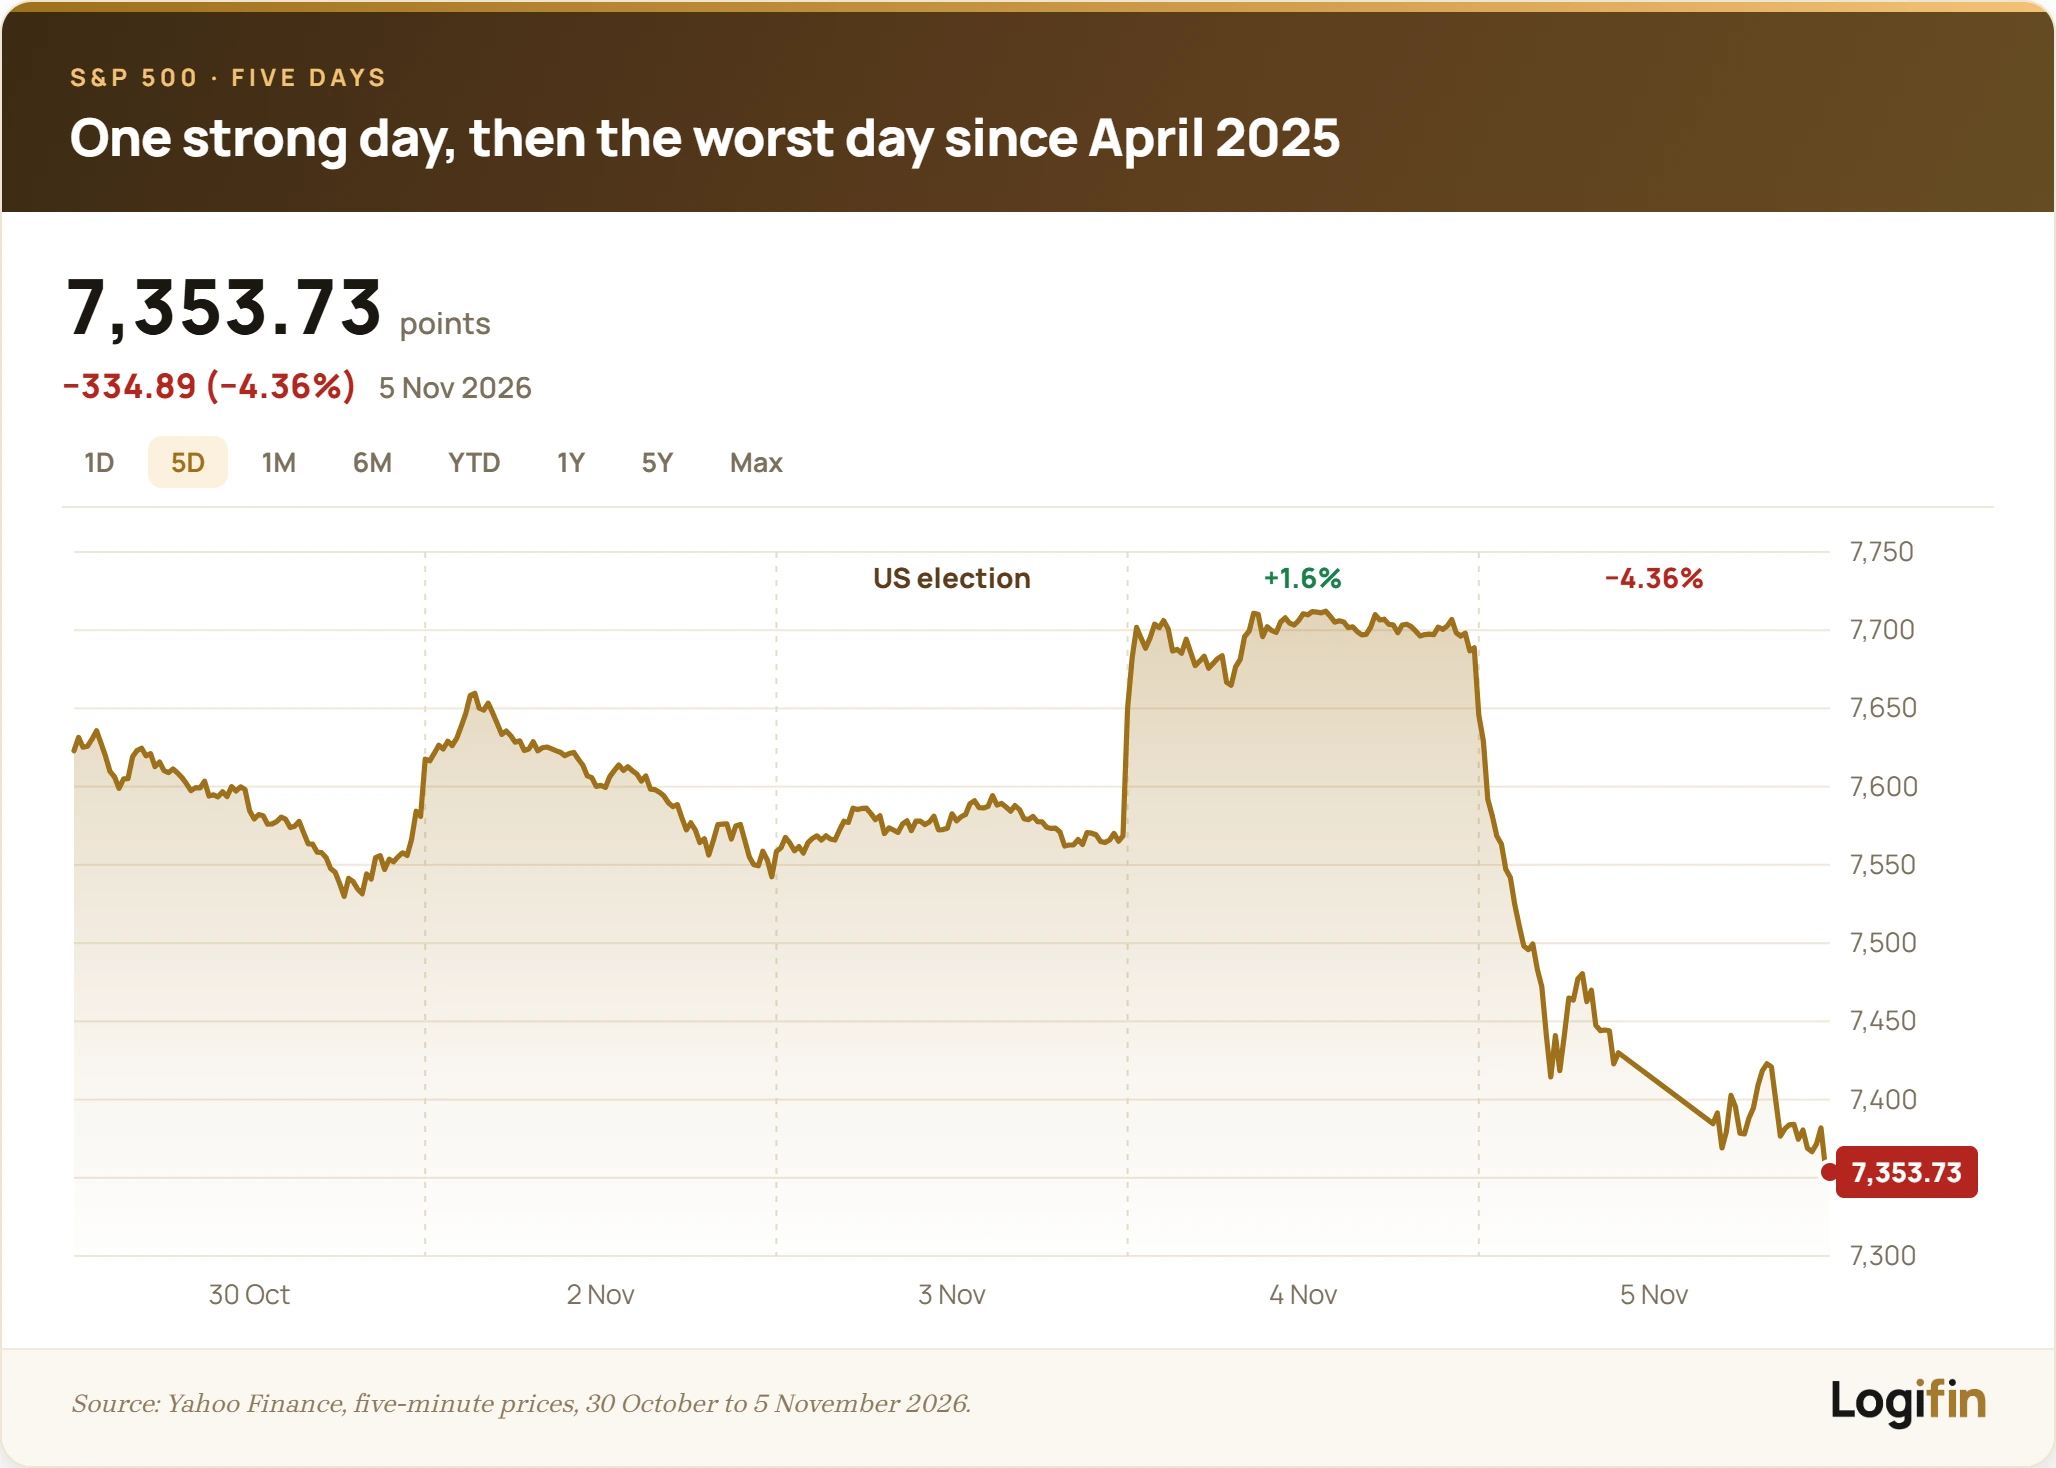
Wall Street had its worst day since April 2025 on Thursday 5 November. The S&P 500 closed down 4.36%, the Nasdaq down 5.52% and the Dow Jones down 3.44%, according to CNBC. About $2.8 trillion of market value disappeared from the S&P 500 in a single day. Investors fear that the large Democratic win will slow the construction of data centres, the buildings that house the computers behind artificial intelligence. The companies that sell chips for those buildings fell the most.
What happened on Wall Street on Thursday
The fall came one day after a large rise. On Wednesday the S&P 500 gained 1.6% and the Dow Jones added more than 1,500 points, its best day since April 2025. On Thursday the Dow lost 1,833 points, more than it had gained.
The SOX index, which tracks chip companies, lost 12.25% and had its worst day since March 2020. One hour before the close the seven large technology companies were down about $900 billion in market value, according to CNBC, with Nvidia alone down $374 billion. The selling reached other sectors too, with Caterpillar down 6% and JPMorgan down 4%.
US government bonds moved the other way. The ten-year yield fell to 4.84% from 4.90%, which means bond prices rose. Gold gained about 1%, while bitcoin lost more than 5%.
Since 2010 the S&P 500 has closed down 4% or more only 19 times, based on Yahoo Finance closing prices. Nine of those were in 2020, the year of the pandemic.
The Nasdaq enters correction territory
The Nasdaq Composite closed at 24,315 points, 11.9% below its record of 27,599.79 points on 6 October. In markets a correction means a fall of 10% to 20% from the high. Beyond 20% the term is a bear market.
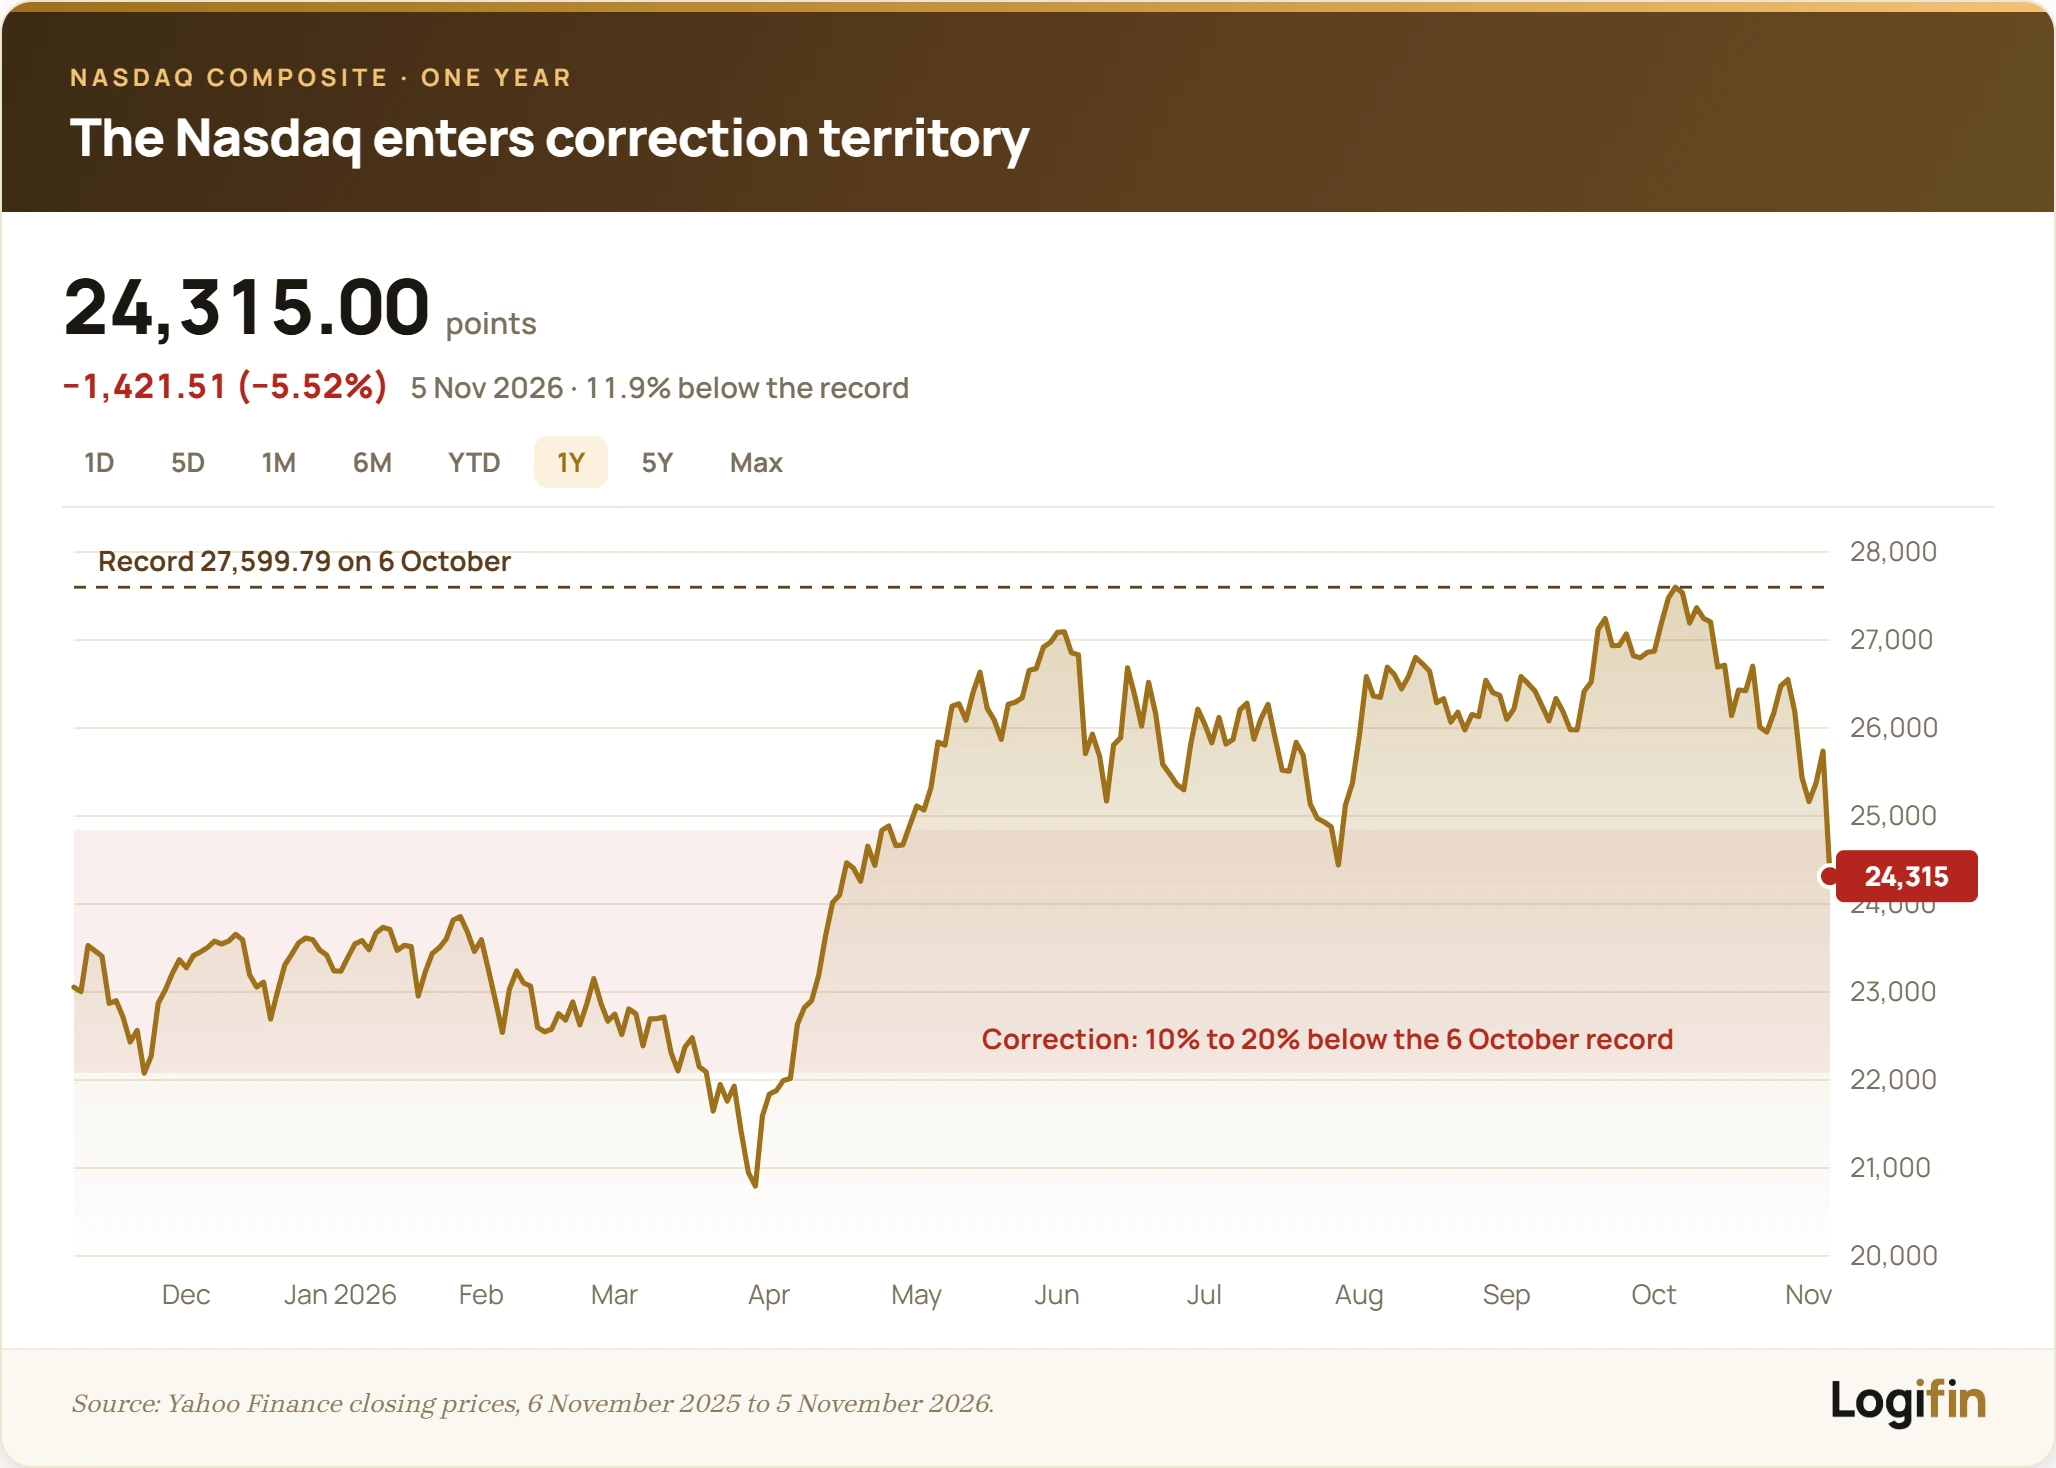
The Nasdaq 100, with the largest non-financial companies on the Nasdaq, has fallen further and stands 14.7% below its record of the same day. The Russell 2000 of smaller US companies also entered a correction, 11% below its record. The S&P 500 is about 6% below its record and the Dow Jones 5.2%, so neither is in a correction. The S&P 500 remains 7.4% above its 2025 close.
Since 2015, when the Nasdaq passed its record of 2000, it has entered a correction 11 times including this one, based on closing prices. Of the 10 earlier cases, six stopped short of 20% and four became bear markets. This is the second correction of 2026. The previous one began on 26 March and the index reached a new record on 15 April. These figures describe the past and do not show where the current fall will stop.
What the VIX index showed
The VIX is calculated by Cboe from the prices of options on the S&P 500. It shows how large the swings are that investors expect over the next 30 days, which is why it is also called the fear index. When investors pay more to protect themselves against a fall, the VIX rises.
On Thursday the VIX closed at 28.18 points from 16.61 on Wednesday, a rise of 69.7% and the third largest in one day since 1990. Only 5 February 2018 and 18 December 2024 saw larger rises, according to Cboe data. The percentage is this large partly because the VIX had fallen 20% on Wednesday, after the election.
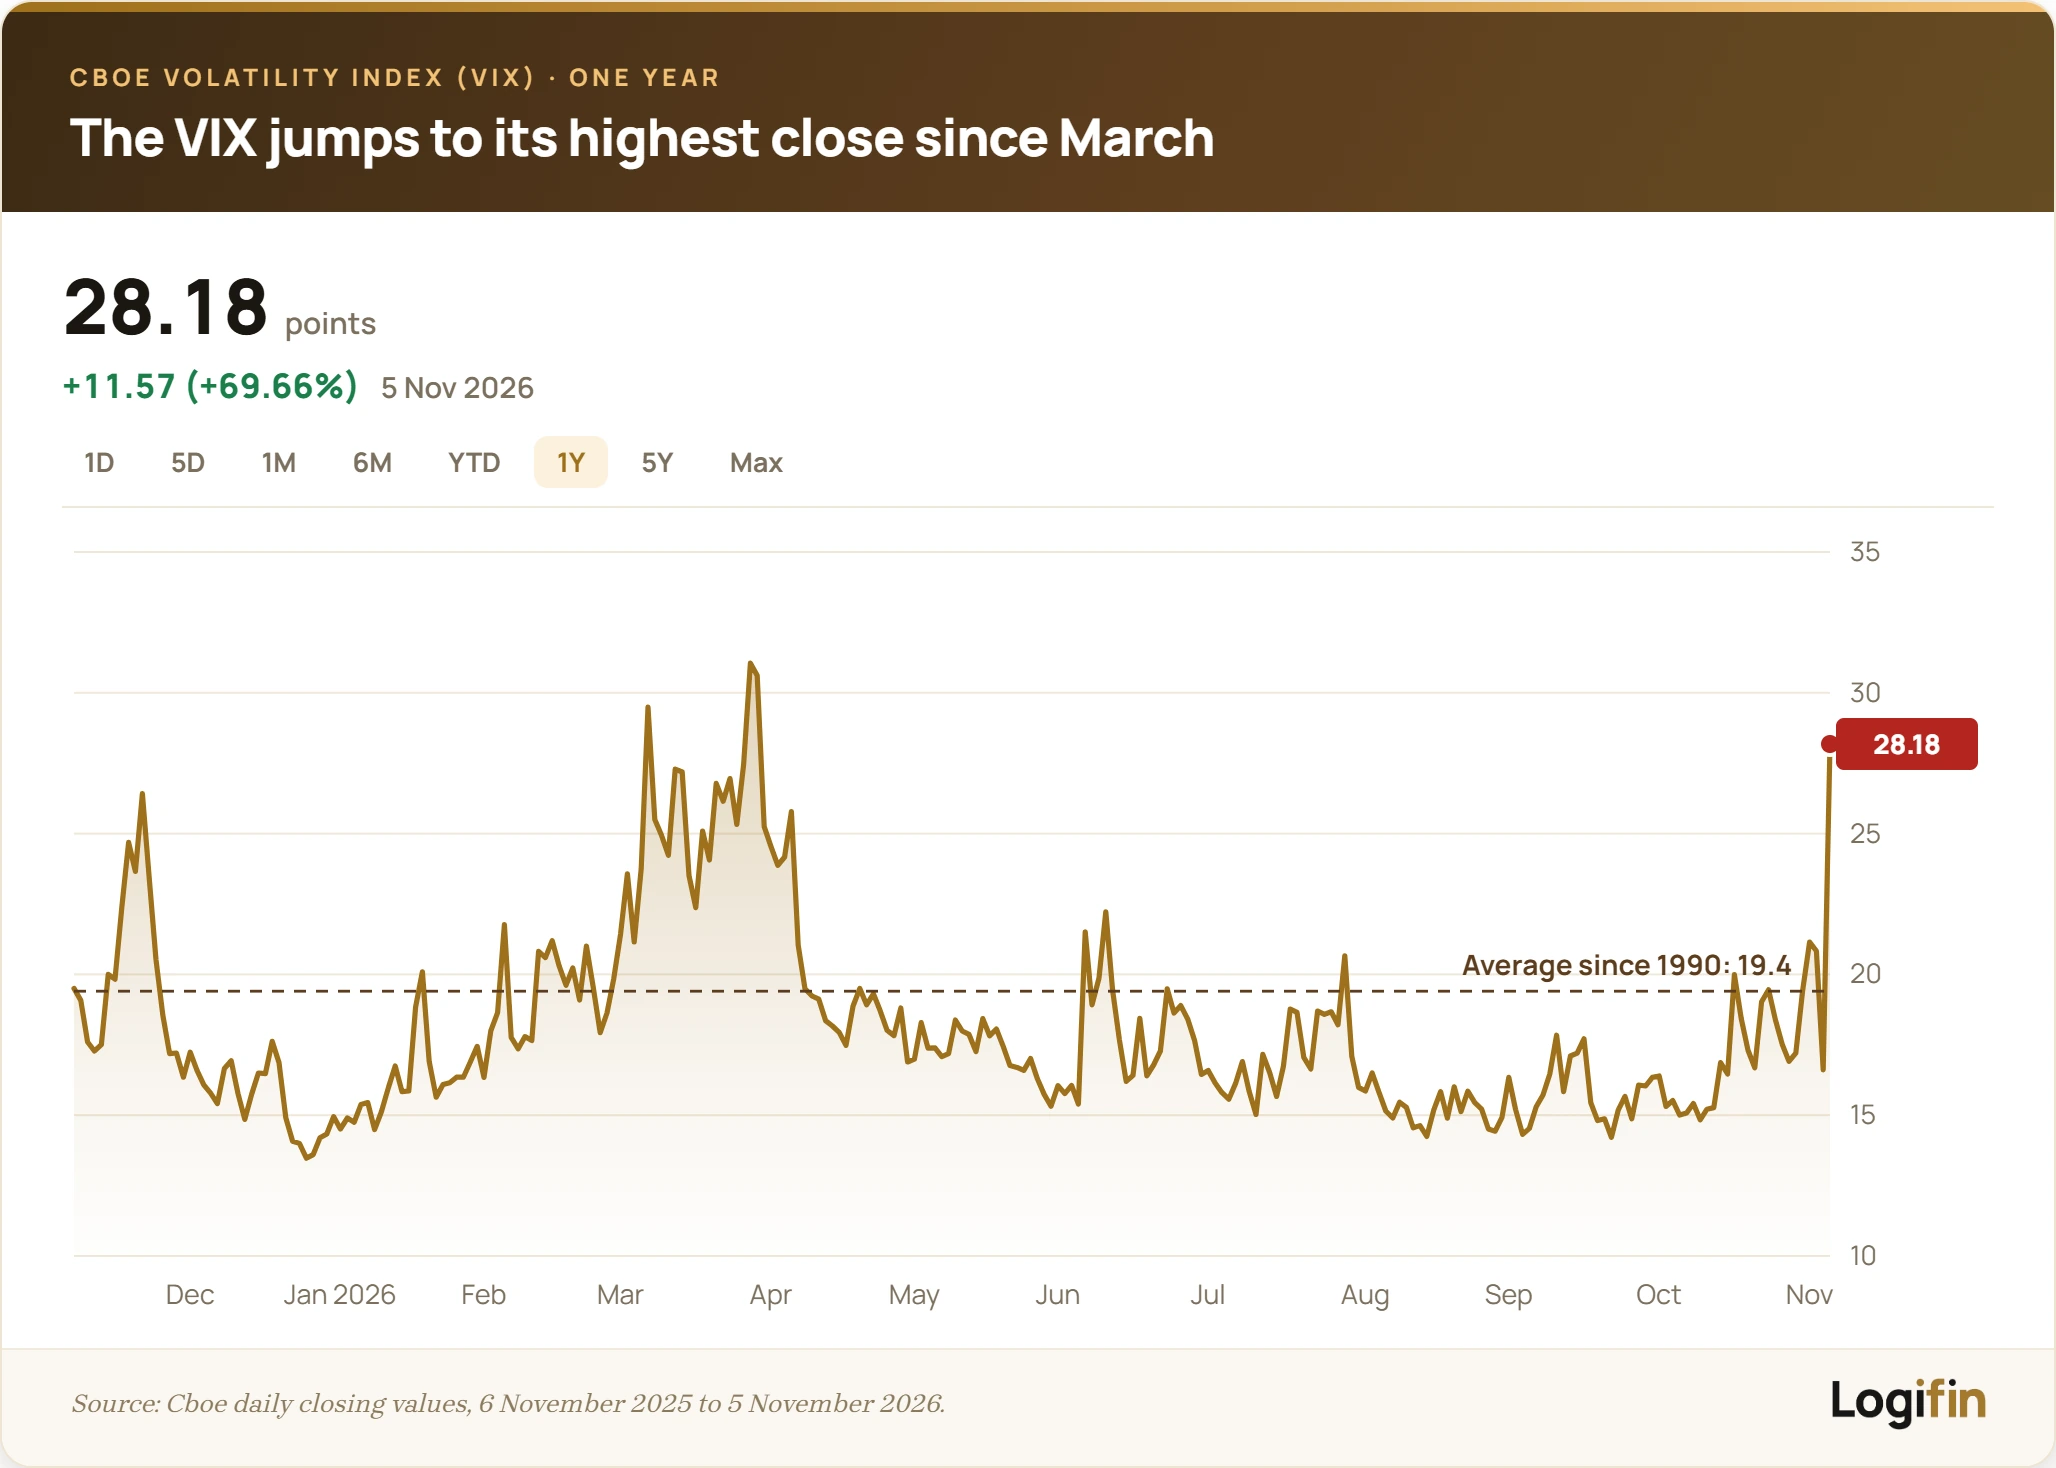
The level of 28.18 points is the highest close since 30 March and sits above the average of 19.4 points since 1990. It is still far from the 52.33 points of April 2025 and the 82.69 points of March 2020. Fear rose sharply without reaching the levels of the great crises.
Why AMD fell after good results
AMD reported record third quarter sales of $13.38 billion on Tuesday evening. That was 45% more than a year earlier and above the roughly $13.06 billion analysts expected, as Yahoo Finance reported. Its data centre sales almost doubled, to $8.5 billion. The share rose 1% on Wednesday and then fell 17% on Thursday.
Results show what a company has already sold, while the share price depends on what the market expects it to sell in the coming years. Chief executive Lisa Su told Yahoo Finance that the market can sometimes be "a little bit short-sighted" and that she believes in the demand.
Chip stocks were already falling before the election. The SOX closed on Thursday 38% below its record of 22 June. On 30 October it had lost 7.2% in one day, after Intel gave a weak forecast for the fourth quarter and its share fell 28.6%. That same week, Alphabet's results had shown how heavily artificial intelligence spending weighs on a company's cash. The Associated Press writes that these stocks have been swinging for months, because expensive borrowing may slow the construction of data centres.
Why the election reached data centres
On 3 November Americans did not vote only for Congress. In many states data centres became a campaign issue, because they need enormous amounts of electricity and water. In Texas, the largest data centre market in the US, Democrat Gina Hinojosa won the governor's race in an upset. During the campaign she had pledged to ban all new approvals until the state legislature passes laws. The Democrats who won in Ohio and Georgia made similar promises.
In 41 local votes across 10 states, voters sided with restrictions in nearly every contest with results by Wednesday. The same day Senator Bernie Sanders called for a national moratorium on new data centres. Goldman Sachs estimates that from January 45% of planned US capacity will sit in states controlled by Democrats who support such moratoriums, as CNN reported.
That does not mean half of all projects stop. CNN notes that Donald Trump remains president with a veto and that governors cannot stop every project. The current Republican governor of Texas, Greg Abbott, has already frozen environmental permits and grid connections since August while an audit of the projects runs. On Thursday the market was not reacting to a new law. It was reacting to the fear that fewer projects will be built than it had assumed. Trump attributed the fall to the election result and blamed the Democrats, as NBC reported.
How a project in Texas reaches Nvidia
The large cloud companies, such as Alphabet, Amazon and Microsoft, spend hundreds of billions of dollars a year on data centres. Analyst Dan Ives of Yorkville Ives estimates that this spending will reach at most $828 billion this year. That money becomes sales for chip companies. A quarter of planned projects are in Texas. Wells Fargo estimates that every 10% less capacity there cuts the AI infrastructure spending of the large technology companies by 1.6%.
That is why the companies that sell fell much more than the companies that buy. Nvidia lost 9.3%, Broadcom 10.4% and Micron 17.5%, while Alphabet and Amazon lost 2.2% and Microsoft 3.6%.
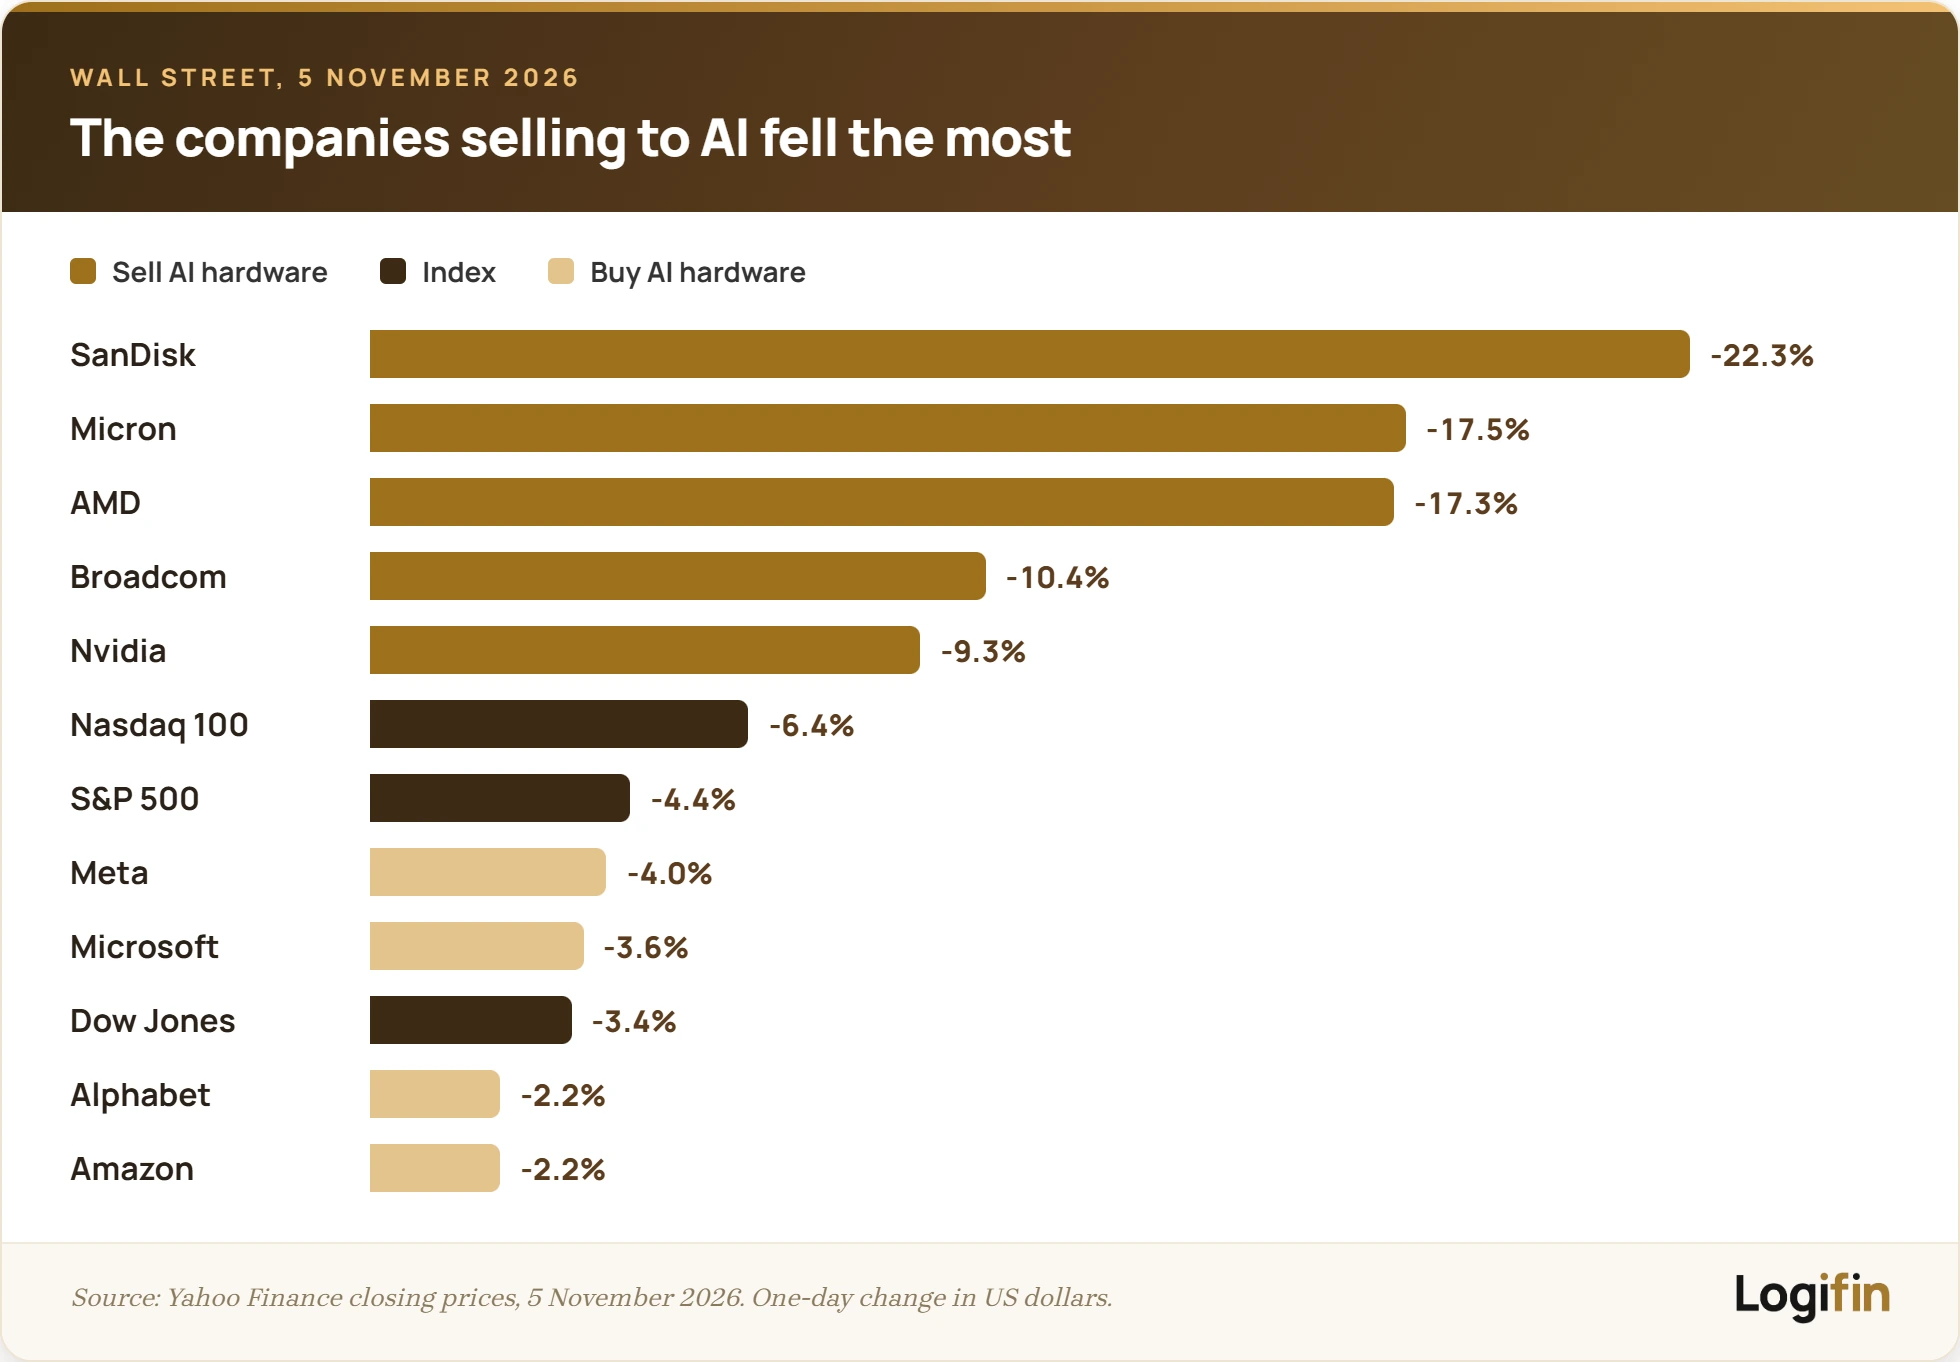
For whoever pays for the data centres, a slowdown also means lower costs. Ives wrote that this could turn out to be positive for technology stocks. For whoever sells chips, the same spending is the sales of the coming years.
Economists at ING estimate, according to CNN, that investment in artificial intelligence provided as much as a quarter of US growth this year. Ed Yardeni of Yardeni Research told NBC that he does not see a bubble bursting but a bubble losing air very quickly.
How Asia and Europe reacted
Asian markets fell two days in a row. On Thursday, before Wall Street opened, South Korea's Kospi lost 5.3%, Taiwan's index 3.2% and Japan's Nikkei 1.8%. On Friday the Nikkei closed down about 6% at 57,435 points, the Kospi down about 6% at 5,060 points and Taiwan down 4.5%. In Seoul the Kospi fell more than 8% at the open and trading was halted temporarily. South Korea and Taiwan depend heavily on chipmakers such as Samsung and TSMC.
In Europe the STOXX 600 index closed down only 0.4% on Thursday, before the Wall Street fall was complete, even though ASML fell 6.5%. On Friday morning it was down about 1.5%. Technology companies make up about 7% of the index, so the fall in chip stocks affects it far less.
What it means for anyone who holds an ETF
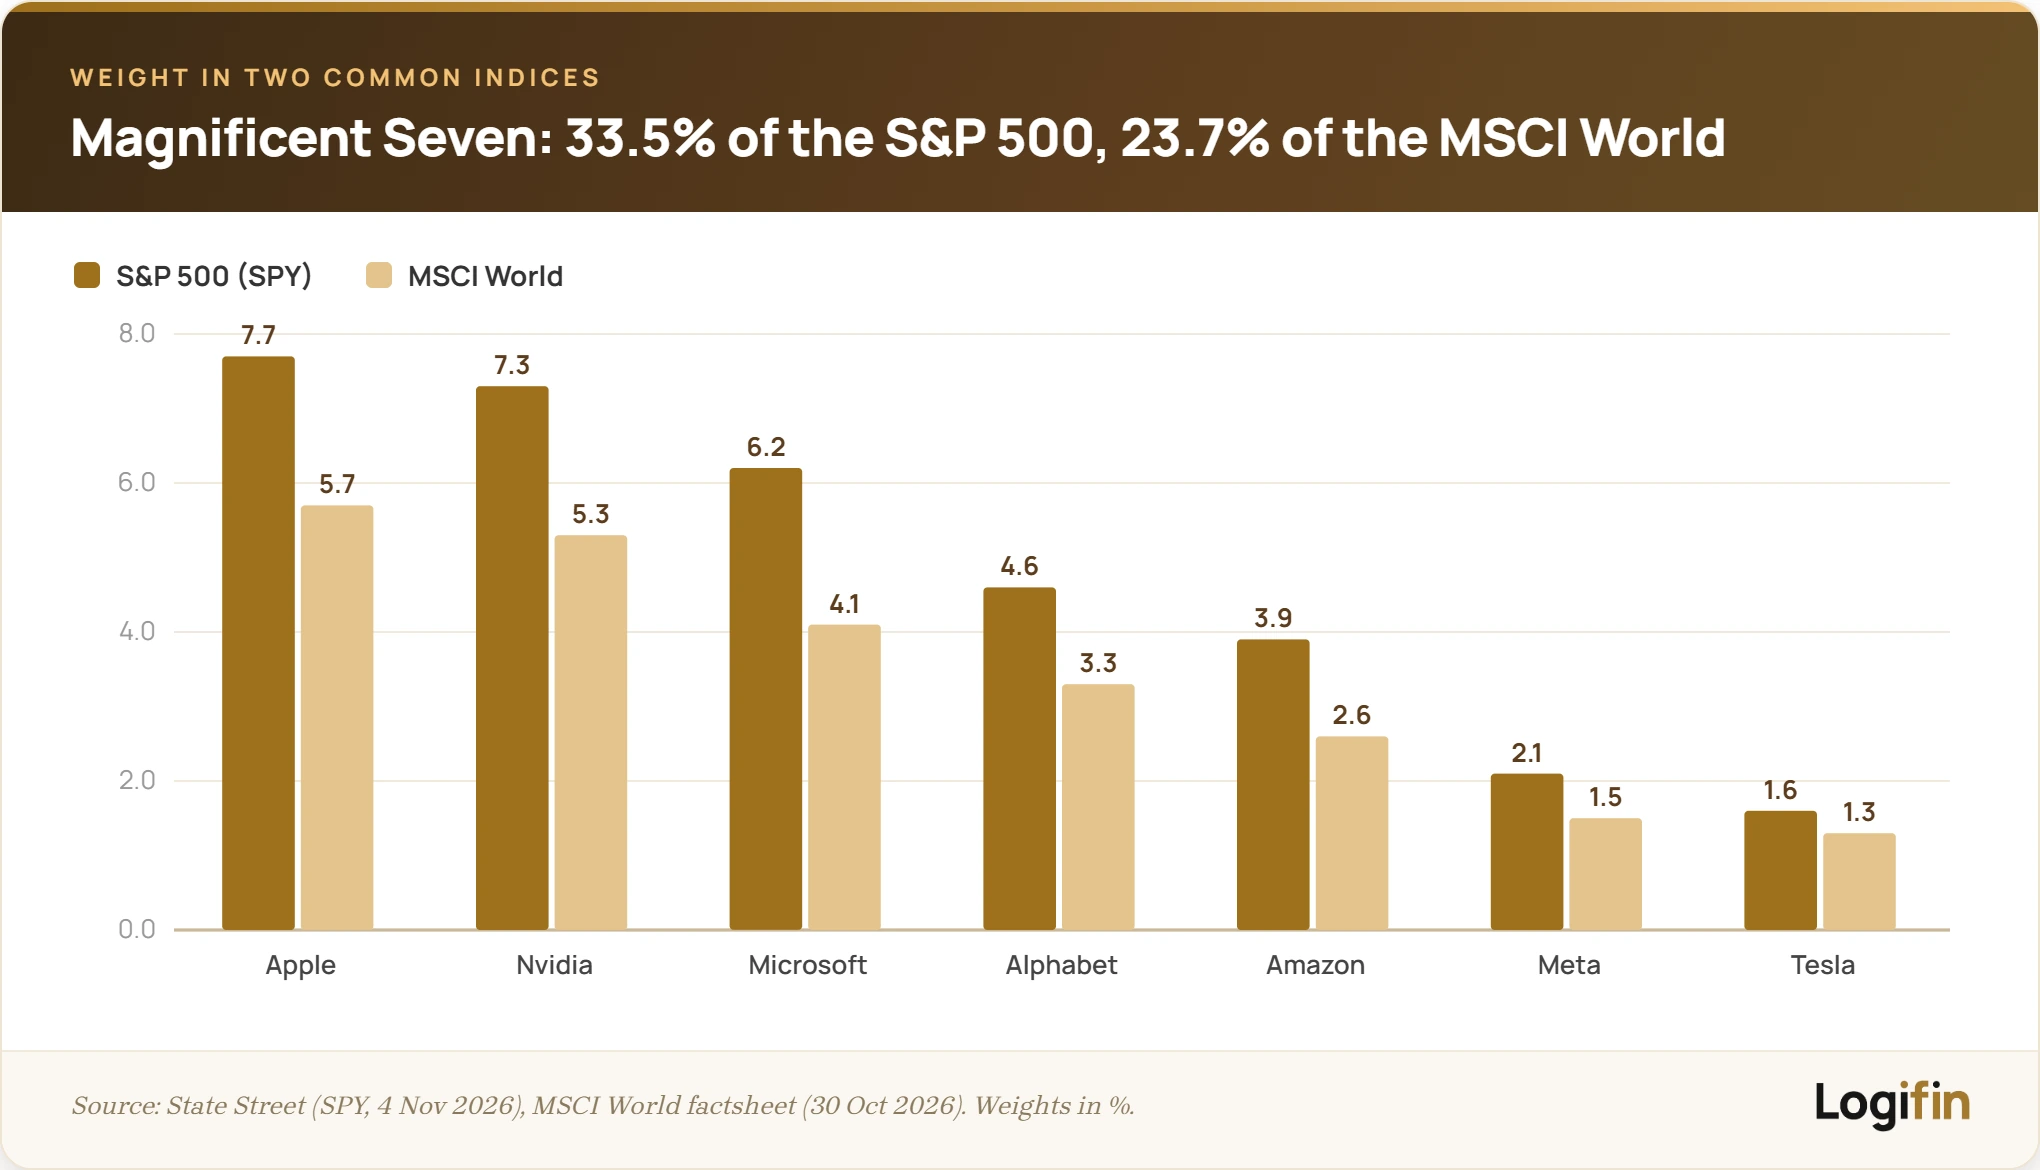
European investors hold these stocks mostly through ETFs, so what counts is how much they weigh in their own fund. The so-called Magnificent Seven, meaning Apple, Nvidia, Microsoft, Amazon, Alphabet, Meta and Tesla, make up a third of the S&P 500 and almost a quarter of the MSCI World. State Street's SPY ETF held 33.5% in them on 4 November and the MSCI World index 23.7% on 30 October, according to the MSCI factsheet.
On the same Thursday HANetf announced the Defiance Mag7 UCITS ETF, which holds only these seven companies in equal parts. The firm describes it as the first of its kind in Europe.
Anyone who looked at an ETF on a European exchange on Thursday did not see the whole fall. Frankfurt's Xetra closed at 17:30 German time, two hours after Wall Street opened, when the S&P 500 was down about 2.9%. VUAA, which tracks the S&P 500, closed down 2.6% on Xetra and VWCE, which tracks a global index, closed down 2.3%. The rest of the fall reached their prices on Friday. At 09:10 German time both were down a further 1.4%.
What to watch
- 6 November. The US publishes its jobs data for October.
- 17 November. Nvidia reports results for the quarter that ended on 25 October.
- December. The audit of data centres in Texas is expected to finish.
- 9 December. The Fed announces its next decision on interest rates.
- 19 January. Hinojosa takes office in Texas, where the state legislature starts work the same month.
What to take away
- The S&P 500 lost 4.36% on Thursday, its worst day since April 2025. The Nasdaq entered correction territory and the VIX reached its highest close since March.
- The market reacted to the fear that fewer data centres will be built, not to a new law. That is why the companies that sell chips fell the most.
- The seven large technology companies make up a third of the S&P 500 and almost a quarter of the MSCI World, so anyone who holds such an ETF is already exposed to them.
Insights
Keep reading



EXPLORE LOGIFIN
Everything you need in order to learn, plan and track your investments.
Logifin Blog
Learn everything you need to get your finances in order and invest with confidence.
Logifin Insights
What moves the markets and what it means for a long term investor. Short and without the noise.
Logifin Tools
Free, inside the site, no signup. Everything you calculate stays on your device.
Logifin ETF Hub
Find the ETF that fits you: 500+ UCITS ETFs, smart filters and in-depth comparisons.
Logifin Guides
A series of guides that builds your investment plan step by step. The first guide is free for everyone.
Logifin Circle
The tools and the Hub are free for everyone. You become a member for the intelligence that never stops.