Logifin Insights
Why did Google fall and not Microsoft?
On the same evening Alphabet shares fell about 10% and Microsoft shares rose about 3%. Both companies doubled their investment in artificial intelligence. Only one of them covered it with the cash from its operations.
29 October 2026 · 7 min read

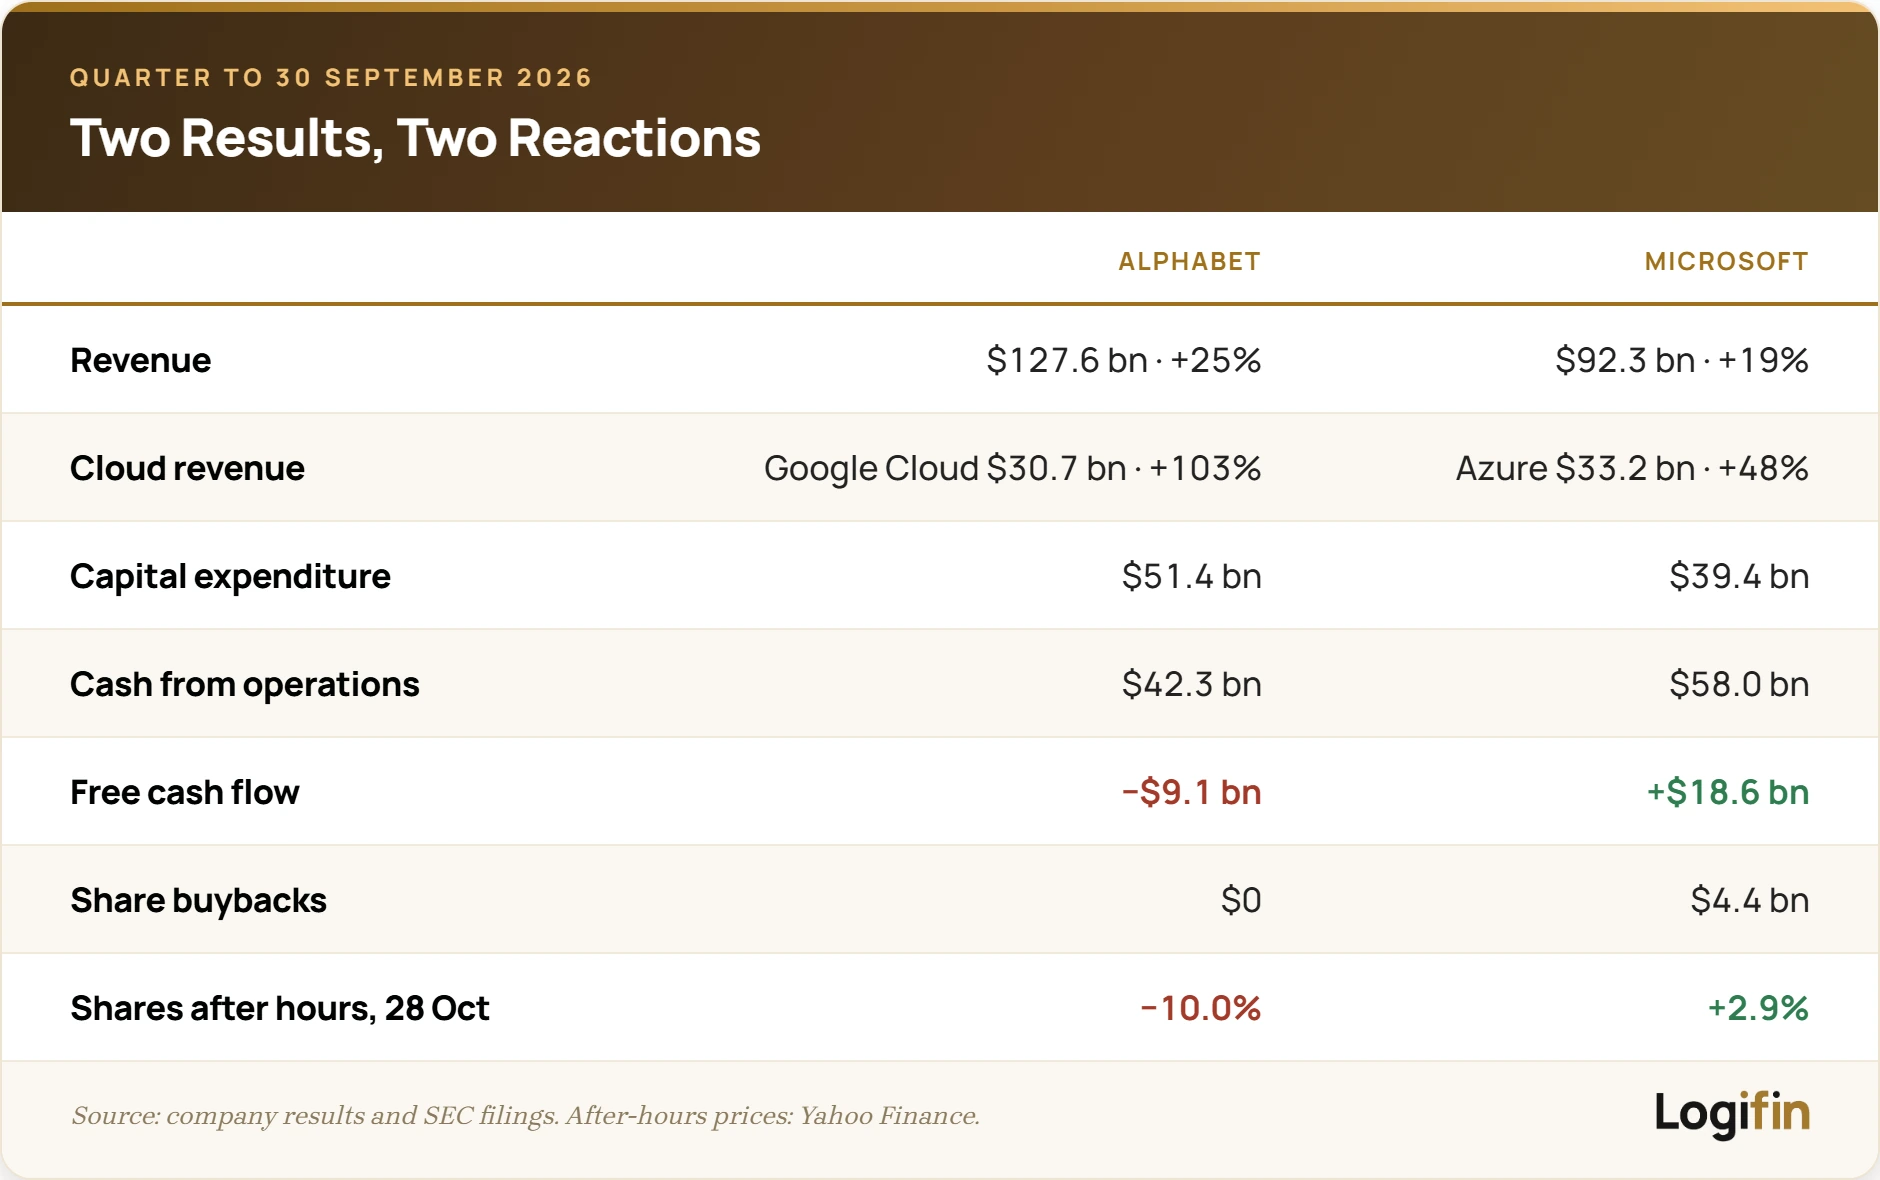
On Wednesday 28 October, after Wall Street closed, Microsoft and Alphabet, the parent company of Google, reported their results for the quarter that ended on 30 September. On the headline numbers the two looked alike. Cloud revenue, meaning revenue from renting out computing power and software over the internet, rose 103% at Google and 48% at Microsoft. Capital expenditure, mostly on data centres for artificial intelligence, doubled at both companies. In after-hours trading, however, Alphabet shares fell about 10% while Microsoft shares rose about 3%.
Cash made the difference. The money generated by Microsoft's operations covered its investment and left 18.6 billion dollars to spare. At Alphabet, investment exceeded the cash from operations by 9.1 billion.
The results of the two companies
Both companies grew their revenue quickly, but only Microsoft beat analyst estimates.
Alphabet's revenue reached 127.6 billion dollars, up 25% from a year earlier. Operating income rose 30% to 40.6 billion. Net income, however, fell to 26.5 billion from 35.0 billion. The decline came mainly from Alphabet's stakes in other companies, which recorded a loss of 8.7 billion in the quarter. A year earlier the same stakes had produced a gain of 10.7 billion. Earnings per share were 2.12 dollars, against an average analyst estimate of 3.01, according to MarketBeat. Revenue was also slightly below the estimate of 127.97 billion.
Microsoft reported revenue of 92.3 billion dollars, up 19%, while analysts had expected 90.7 billion, according to SiliconANGLE. Net income rose 32% to 36.6 billion. For the first time the company disclosed revenue from Azure, its cloud service, in dollars: 33.2 billion in the quarter. Contracts signed by its business customers that have not yet turned into revenue reached 677 billion, up 73%.
Why Alphabet shares fell
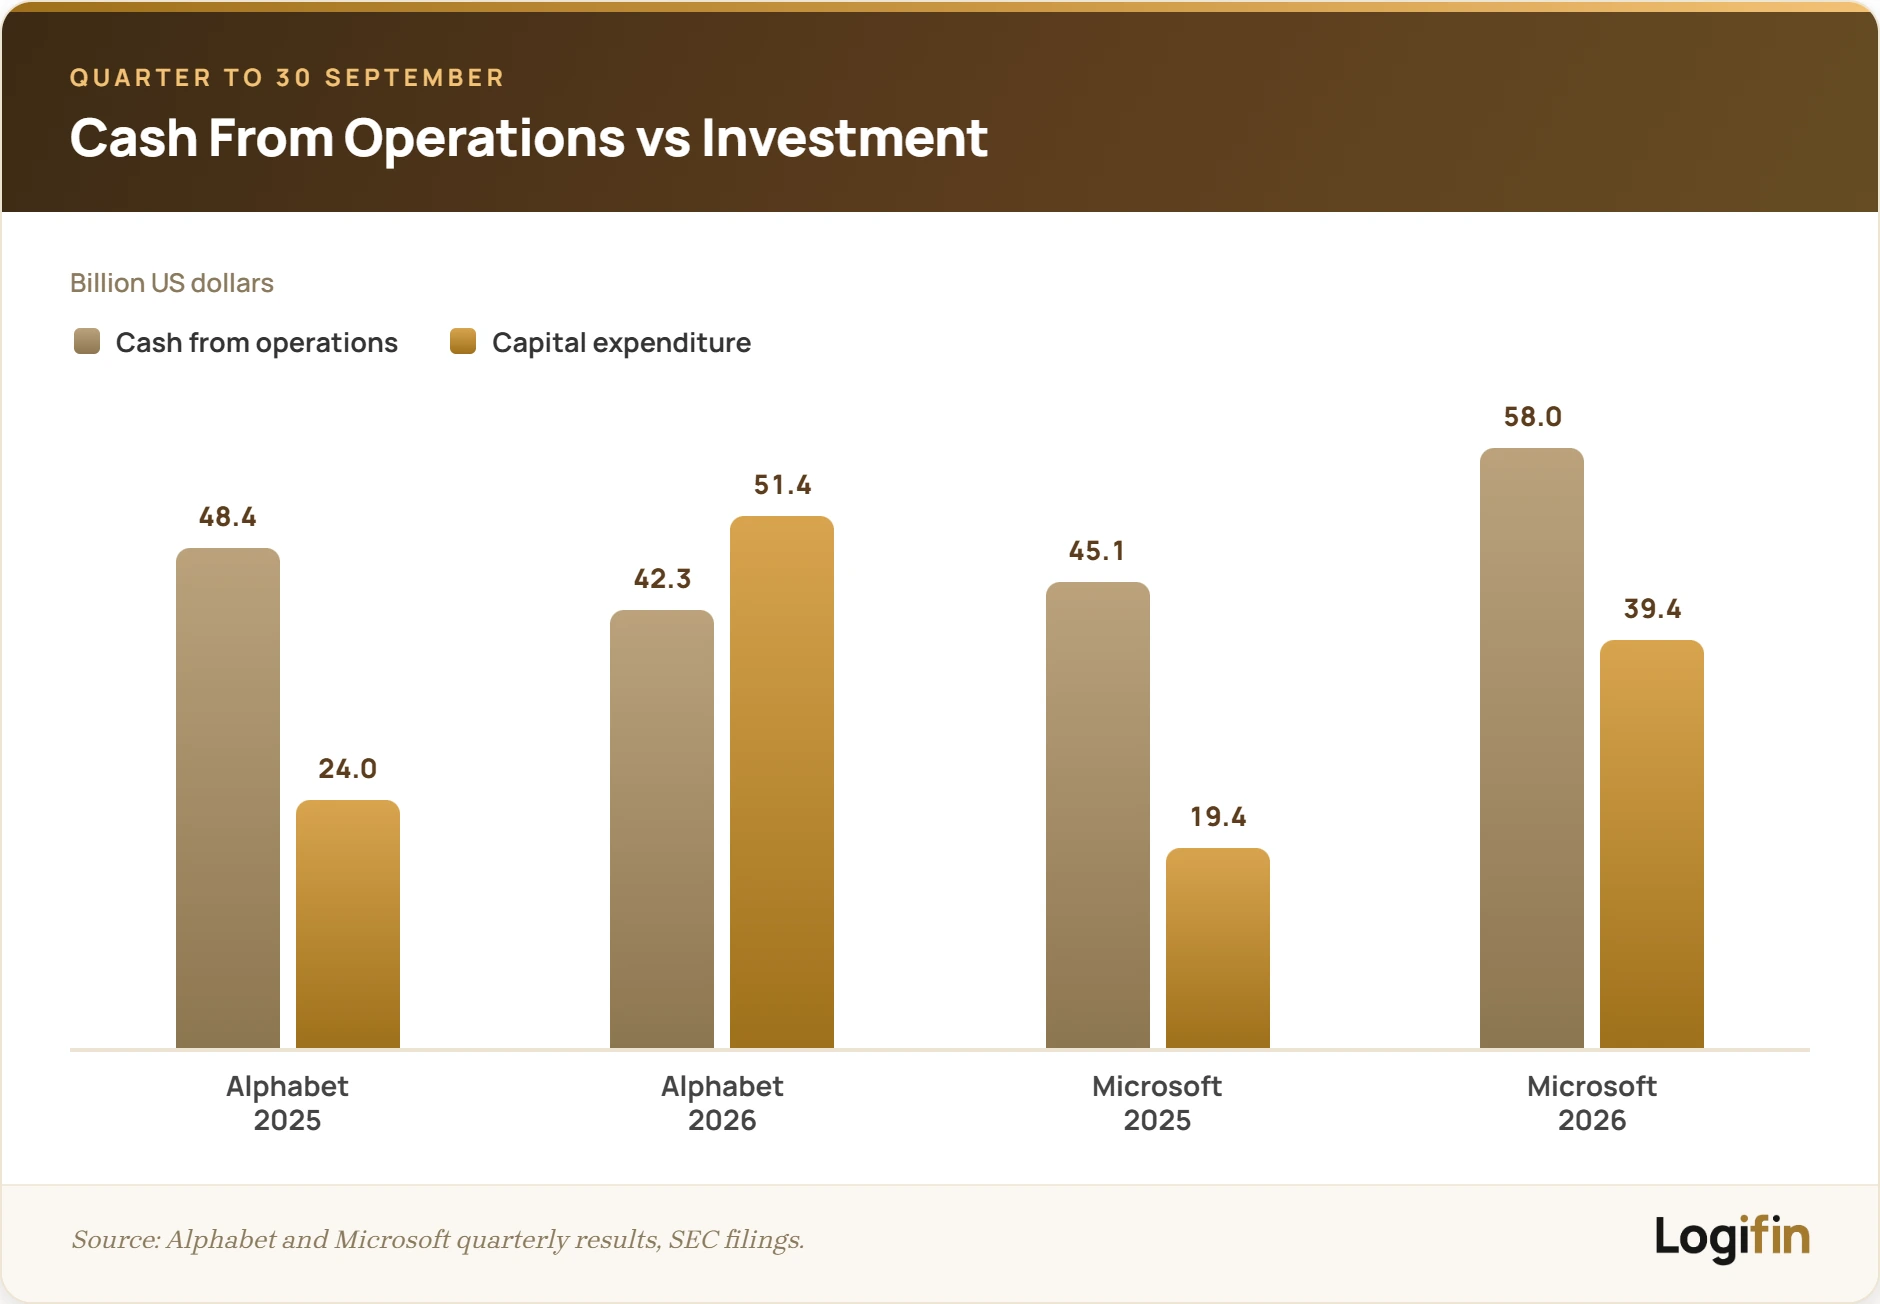
In the quarter Alphabet invested 51.4 billion dollars in fixed assets, mostly data centres and servers. A year earlier the figure was 24.0 billion. This spending is part of the large investment in artificial intelligence by the big US technology companies. Over the same period the cash from Alphabet's operations fell to 42.3 billion from 48.4 billion.
The difference between the cash from operations and capital expenditure is called free cash flow. At Alphabet free cash flow was negative, at minus 9.1 billion, for the second quarter in a row. In the quarter to June it was minus 5.9 billion.
Over the same period Alphabet stopped buying back its own shares. In the third quarter of 2025 it had spent 11.5 billion on buybacks, while in the second and third quarters of 2026 it spent nothing. Dividends continued, at 2.9 billion in the quarter.
The evening's reports on MarketScreener linked the fall to the doubled investment and to the cash that left the company. For the whole of 2026 Alphabet expects capital expenditure of 195 to 205 billion, an estimate it raised in July. Since April it has said that investment in 2027 will be significantly higher.
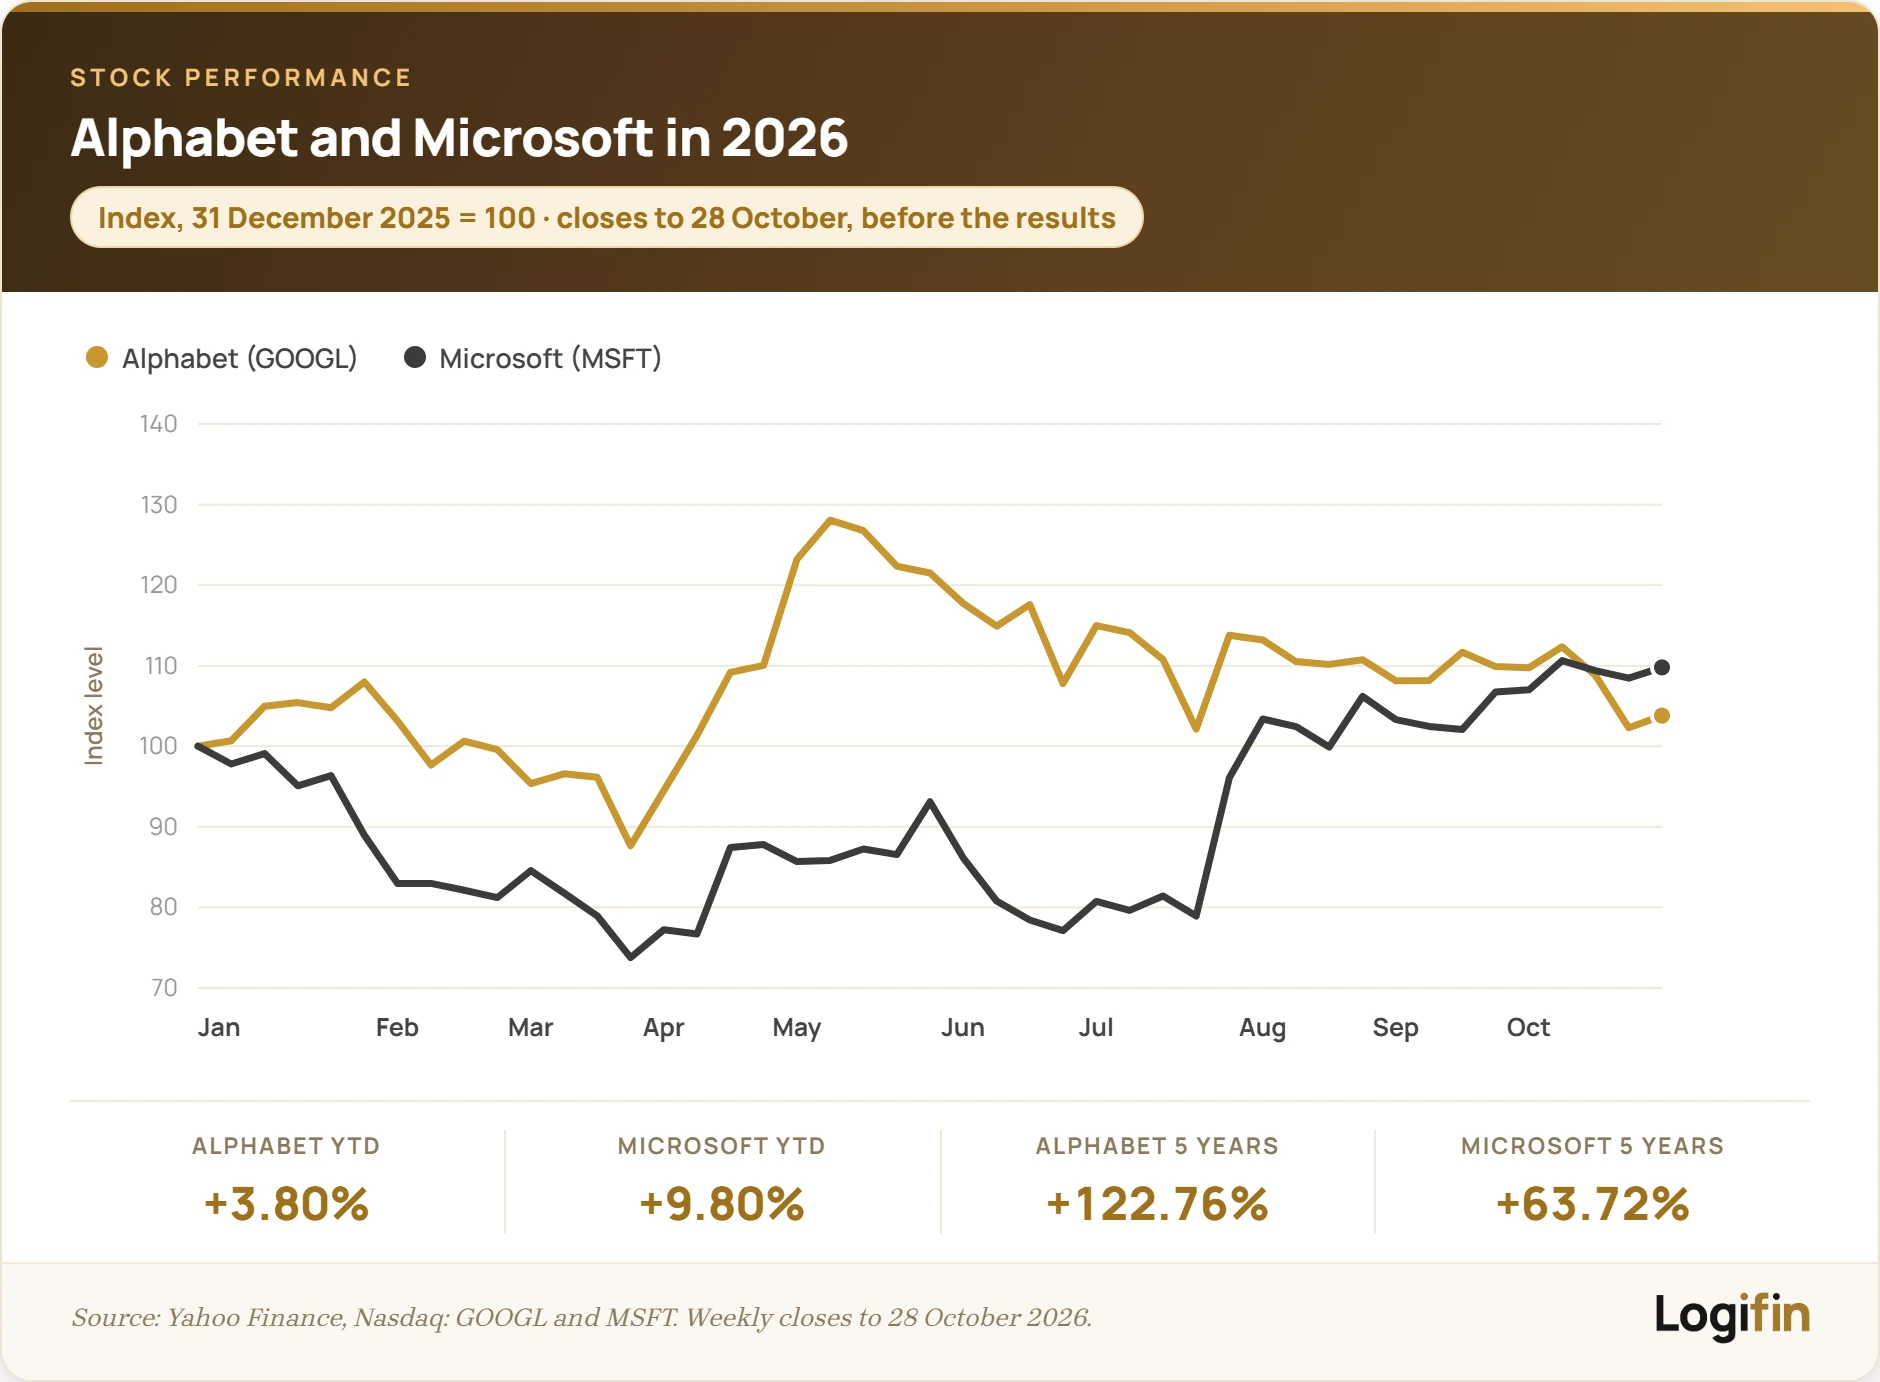
The drop came in a stock that had already moved away from its high for the year. On 13 May Alphabet closed at 402.62 dollars. On 28 October it closed at 324.89, which is 19% lower. After the close it fell to around 292.5. Microsoft, by contrast, closed at 531.01 dollars, close to its high for the year of 543.45 on 13 October.
Why Microsoft shares rose
Microsoft also doubled its investment. In the quarter it spent 39.4 billion dollars on fixed assets, up from 19.4 billion a year earlier. Its cash from operations, however, started from a higher level and grew 29% to 58.0 billion. After its investment the company had 18.6 billion left, from which it paid 6.8 billion in dividends and bought back 4.4 billion of its own shares.
Azure revenue beat the analyst estimate of 32.3 billion. For the next quarter Microsoft expects Azure to grow 49% to 50% at constant exchange rates, while analysts had expected 45.1%. According to SiliconANGLE, chief financial officer Amy Hood said free cash flow will remain positive throughout fiscal year 2027, which for Microsoft ends in June 2027.
Why the market watches free cash flow
When free cash flow is positive, a company pays for its investment out of the cash its operations generate and still has money left for dividends and share buybacks. When it is negative, the gap is covered from cash reserves, from borrowing or from issuing new shares.
Alphabet does not have a liquidity problem. On 30 September it held cash and marketable securities of 265.1 billion dollars, against long-term debt of 125.1 billion. What matters to the market is how long it will take before the new infrastructure brings in more cash than it absorbs.
The market reacted the same way a week earlier to Meta, when its investment exceeded the cash from its operations for the first time since 2012. Its shares rose in after-hours trading but closed the next day down 6.98%.
What it means if you hold an ETF
Most European investors own these two stocks through ETFs that track the S&P 500 or global indices. According to the holdings of the SPDR S&P 500 ETF, which replicates the index, on 27 October Microsoft was the third largest company in the S&P 500, with a weight of 5.91%. Alphabet weighed 5.08%, split across two share classes: GOOGL at 2.82% and GOOG at 2.26%.
If the after-hours moves hold in today's session, Alphabet will take about half a percentage point off the index and Microsoft will add less than 0.2. In an ETF that tracks a global index the effect is smaller, because US stocks make up only part of the index.
The ATLAS guide explains how the weight of each company in an index is set. The Logifin ETF Hub shows which index each US equity ETF tracks.
What to watch
Few buyers and sellers take part in after-hours trading, so the price can change noticeably in the regular session. Wall Street opens today at 9:30 New York time.
The next meaningful figure for Alphabet is its estimate of capital expenditure for 2027. The company usually gives it with its fourth-quarter results, early in the following year. At Microsoft investors will watch whether Azure grows as fast as the company expects. They will also watch whether free cash flow stays positive, as management has said it will.
What to take away
- Alphabet and Microsoft both doubled their capital expenditure within a year. The market judged them by whether the cash from their operations was enough to pay for it.
- Microsoft had 18.6 billion dollars left over. Alphabet was 9.1 billion short for the second quarter in a row and has not bought back any shares in the last two quarters.
- In an S&P 500 ETF the two companies together weigh almost 11%, so an evening like this one shows up in the fund's return.
Insights
Keep reading



EXPLORE LOGIFIN
Everything you need in order to learn, plan and track your investments.
Logifin Blog
Learn everything you need to get your finances in order and invest with confidence.
Logifin Insights
What moves the markets and what it means for a long term investor. Short and without the noise.
Logifin Tools
Free, inside the site, no signup. Everything you calculate stays on your device.
Logifin ETF Hub
Find the ETF that fits you: 500+ UCITS ETFs, smart filters and in-depth comparisons.
Logifin Guides
A series of guides that builds your investment plan step by step. The first guide is free for everyone.
Logifin Circle
The tools and the Hub are free for everyone. You become a member for the intelligence that never stops.